

Nowadays computer technologies are an integral part of geological and geophysical data interpretation and geological modelling. At different modelling stages and interpretation it is necessary to build 2D grid models (depth maps, gross sand, net sand pay, porosity, oil saturation, etc.). It should not be forgotten that one of the key work results presentation is a set of all kinds of maps.
There is no specialized software on the market, which allows to fully carry out a wide range of tasks related to mapping technologies (interpolation, analysis, editing, visualization, plotting), prognosis and integration of geological and geophysical data. The existing software products, in general rule, occupy another slot – seismic interpretation, 3D geological modelling, WLD – systems, reserves estimation and others, which appears in insufficient set of capabilities for 2D geological and geophysical modelling. Many technologies are somehow presented in other software products where experts have to work with, which often do not allow to get the desired result.
The necessary features are presented in IngeosMAP (iMAP)® software, patented by INGEOSERVICE LLC company. IngeosMAP (iMAP)® software, the main objective is 2D-geological digital modelling, presents qualitatively new opportunities for editing (including local, involving point objects, polygons and lines, as for both plicative and disjunctive surfaces) and data analysis, which provide modern programming tools, an easy and intuitive user-friendly interface was created, the great potential for the further increasing of a wide range of tasks, which are within the competence of the specialists: geologists, interpreters, geological modeling specialists, reserves estimation specialists.
INGEOSERVICE LLC obtained a patent for its IngeosMAP (iMAP)®, software product registered by the Federal Intellectual Property Service (Rospatent).
A software’s demo-version can be downloaded here – DOWNLOAD THE DEMO-version.
A program detailed presentation and its capabilities can be found here – DOWNLOAD INGEOSMAP PRESENTATION.
Main advantages and tasks to be solved by IngeosMAP (iMAP)®software:
- full cycle of operations with 2D models: import / export, interpolation, visualization, analysis, editing, export and printing of graphic enclosures, storage of designed graphic applications and pictures in the project;
- multilinear regression with automatic search for the best solution;
- operating with faults, disjunctive tectonics accounting during interactive editing and smoothing of grids;
- automatic correction (tying) of the grid by linear and point (wells) objects, integral correction along vectors taking into account faults;
- frequency decomposition, spectral transformations;
- classification with the building of a matrix of classes, classifications with and without standards;
- method of automatic well validation (estimation of building accuracy);
- crossplots building: Grid / Grid with the ability to select an area and display it on the map, Points / Points with interactive exclusion of their part from the analysis;
- operations with Big Data;
- operations with both rectangular and geographic coordinates, coordinate conversion;
- automatic building of an isochoric / isopachic triangle.
Received positive feedback from software users:
Learn more about the features of the program.
Software technologies
The IngeosMAP (iMAP)® software uses open cross-platform libraries Qt, Qwt, OpenCV, VTK.
Cross-platform allows you to develop and run the program on Windows and Linux operation systems. The openness of libraries makes it easy to find the necessary information on the use of libraries. The framework Qt is the basis of the application, which is used to build the user interface. The Qwt library makes it easy to integrate graphical data visualization into the application in the form of graphs, crossplots, histograms. OpenCV contains the implementation of many valuable algorithms for processing and classifying data. VTK is a 3D visualization and data processing library that allows you to create 3D scenes with a visual representation of data and manage these scenes. Almost all counting algorithms of the software are parallelized into several worflows (depending on the number of processor cores), each of which processes its own data areas A separate flow is responsible for distributing data among workflows. Its task is to ensure uniform loading of workflows (so that they finish working at the same time) and interaction with the user (progress report, cancellation).

Software technologies of the IngeosMAP (iMAP)®
The project file SQLite is a database, which provides a simple database structure, no encryption, the ability to write a third-party utility to read and write the project file.
Main application window
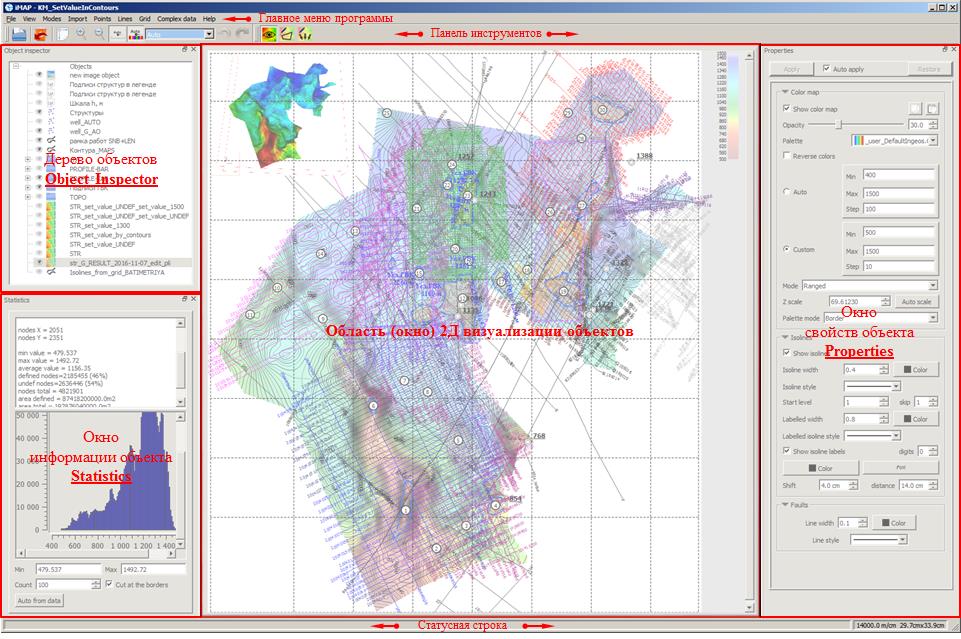
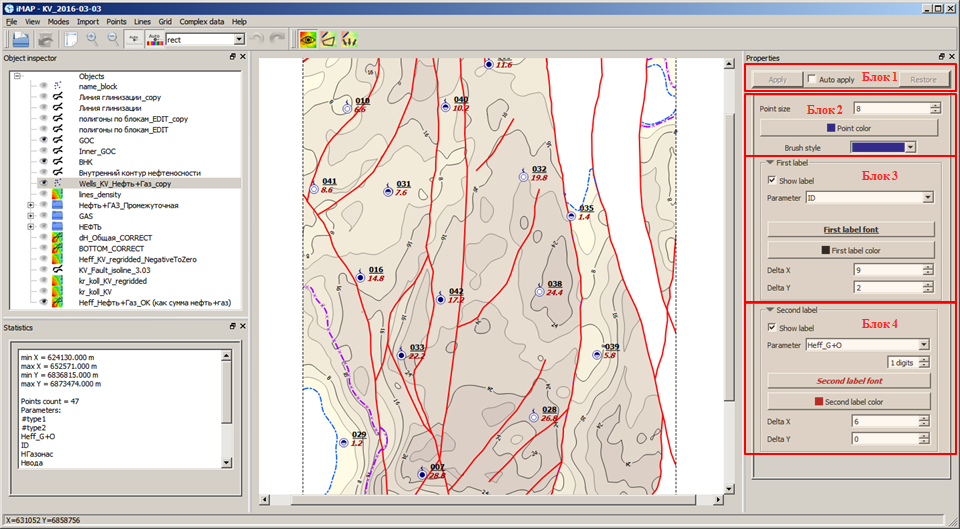
The main window of the IngeosMAP (iMAP)® software includes the main menu of the program, a toolbar, a 2D object visualization area, an object tree, object visualization properties and statistics windows, and a status line that displays position coordinates on the left mouse, and on the right, information on the current scale and size of the 2D visualization area.
 Main application window
Visualization of grid objects
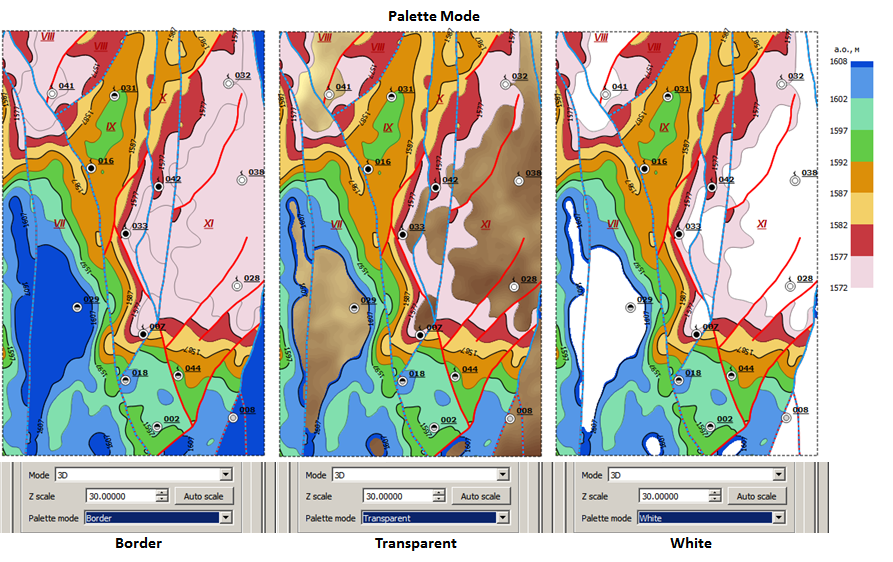 Palette mode option for color palette
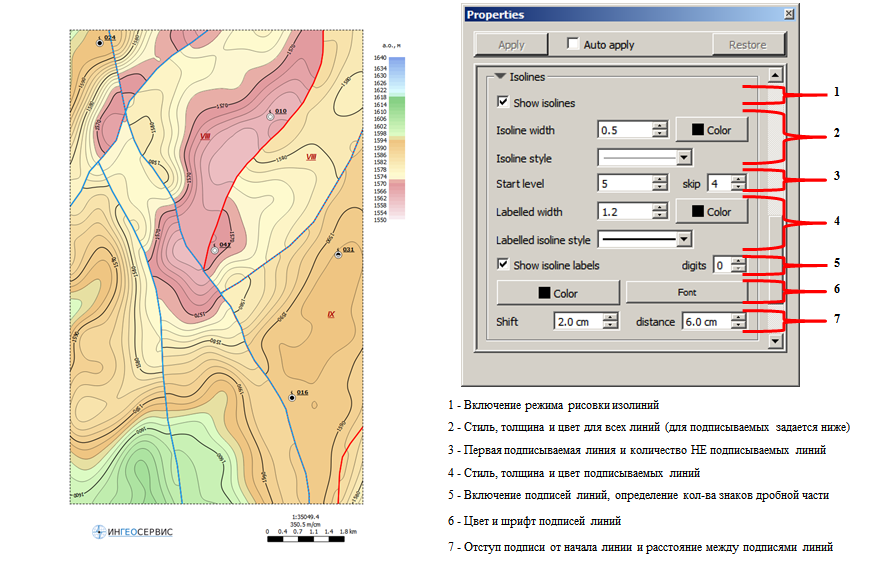 Drawing isolines and their labels
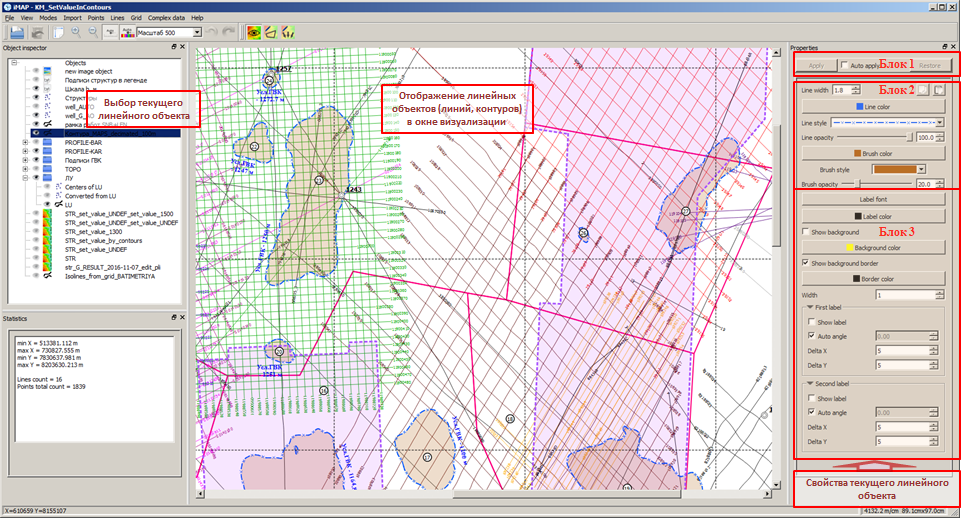
Visualization of linear objects
Visualization of point objects
Color palette editor
The software provides a wide range of color palettes for grids by default, stored permanently in the “…Program Files\iMAP\palettes” folder. In addition to the presented set, the user can independently create new ones and edit existing ones.

Calling a window for creating and editing a color palette
Object Types in iMAP®

Object types in IngeosMAP (iMAP)®
IngeosMAP (iMAP)® software: grid (uniform grid data – grids, grids); points (arbitrary set of points given by coordinates and, as a rule, by attributesи); linear, consisting of an arbitrary set of lines and contours; vector, based on the representation as vectors of three independent grid objects (length, angle of rotation and color); text, used for labels on the map of elements for various purposes; bitmap, with the ability to load images from a file or from the clipboard.
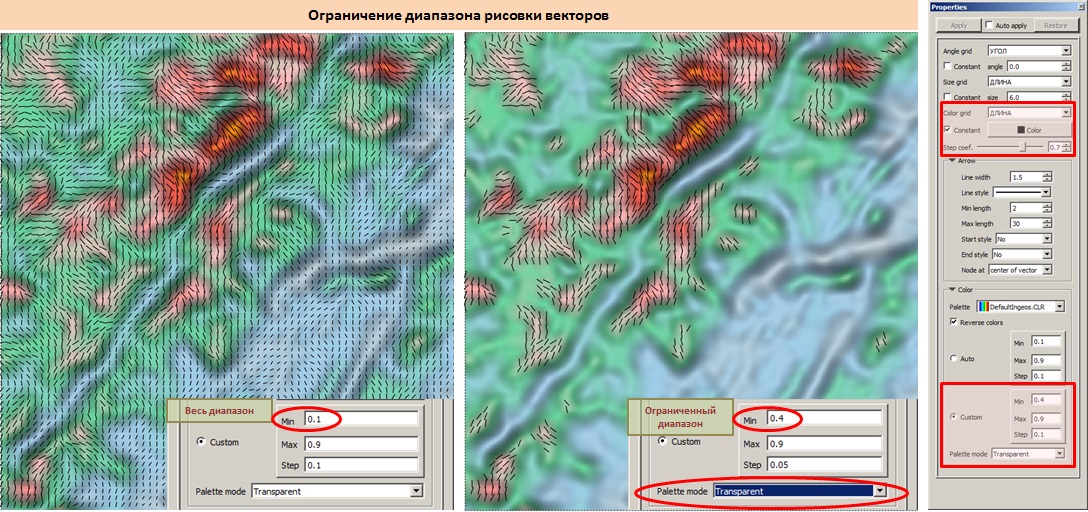
An example of visualization of a vector object
Grid object data formats
Supported grid object formats: Surfer Grid ASCII; Surfer 6 Binary; Surfer 7 Binary; ZMap ASCII; CPS ASCII; Earth Vision scattered ASCII; Irap RMS Classic Grid ASCII; Isoline-GIS text grid ASCII.
Linear Object Data Formats
The following linear objects formats are available: BLN Golden Software Blanking (*.bln), Landmark cultural data files (*.asc), CPS-3 lines (ASCII) (*.*). Ability to convert point objects into linear objects.
Software operation modes
There are several modes of operation in IngeosMAP > software, the buttons for switching which are located on the toolbar main window of the program.
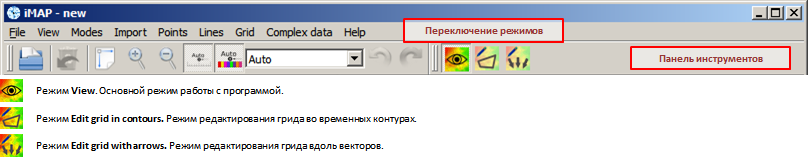
Switching operating modes in software
Editing a Grid in Temporal Outlines
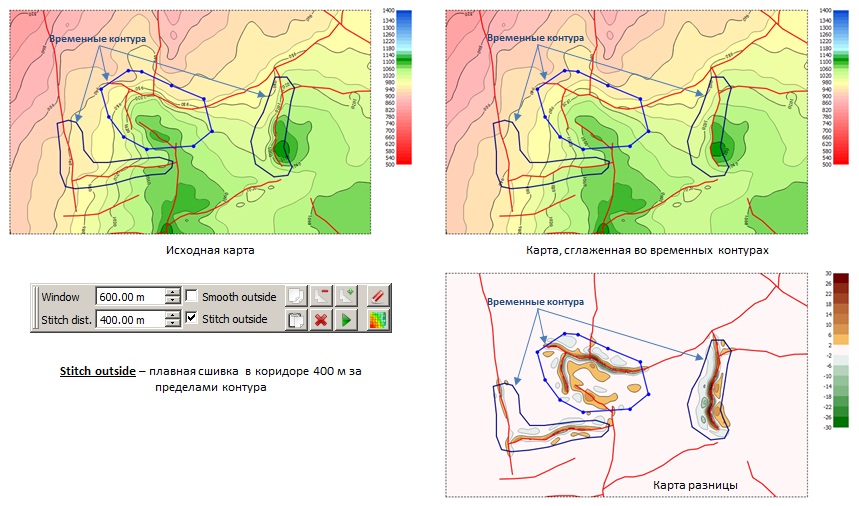
Changes in the grid occur inside (outside) the given contours, taking into account faults, the number of which can be arbitrary. The user has the ability to change the geometry of temporary contours at any time. The main parameters for anti-aliasing and smooth stitching are Window and Stitch dist.. When operating in the Edit grid in contours functions are available Undo – step back and Redo – step forward.
Smoothing inside temporary contours
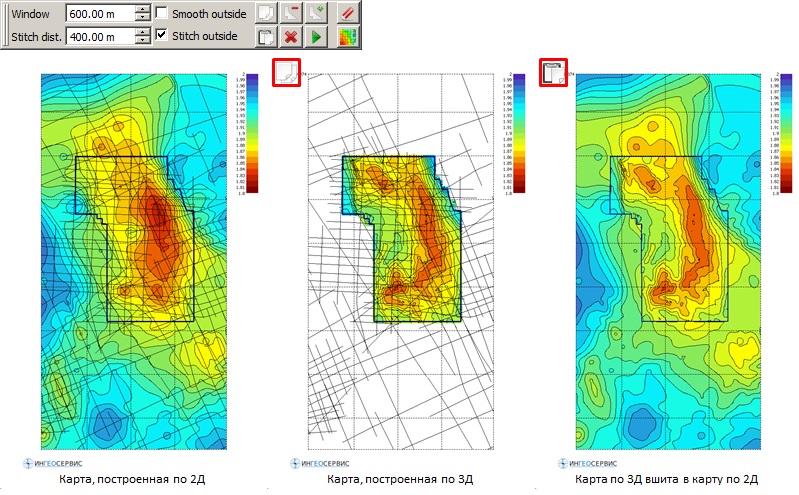
Pasting a fragment of one grid into another
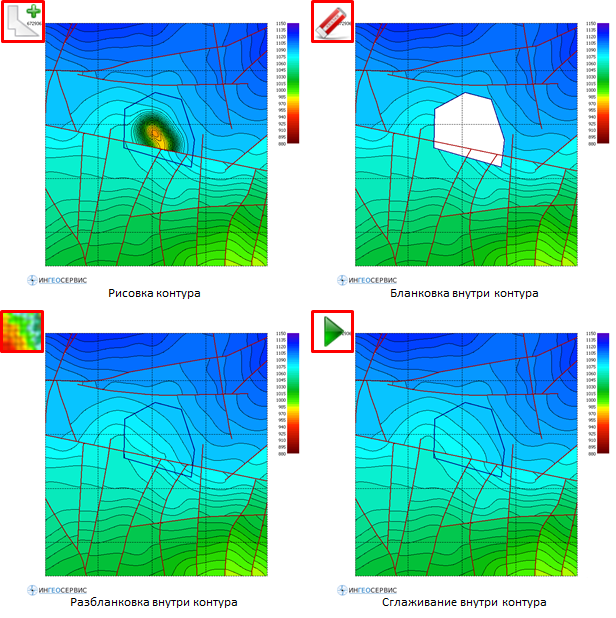
Blanking and unblanking the grid
Edit grid with arrows (Grid editing along vectors)
In this mode, manual interactive editing of the grid is carried out, taking into account the geometry of the fault lines. Changes in the grid occur along the direction of the vectors, the number of which can be arbitrary. The distribution of the changes being made along the vector is determined by the input parameters Radius and Power. When operating in the Edit grid with arrows mode (editing the grid along vectors), the user can use the Undo – step back and Redo – step forward functions.
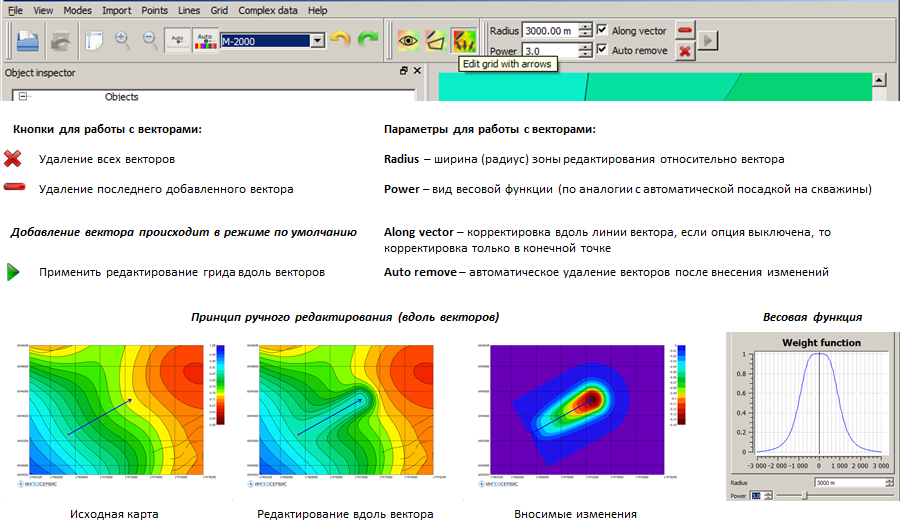
Functionality and flow chart of editing grid models using vectors
The following figure shows examples of an interactive grid using vectors. The upper part shows the original grids with overlay of vectors along which the grid is adjusted. Below are the results of editing. The left example reflects local (Radius = 1000) editing of the grid model along the faults. The example in the center is shifting the gradient zones to a wider (Radius = 3000) band. The example on the right is local, non-through (Along vector is off) editing with Radius = 3000.

Examples of grid editing along vectors
Another example illustrates the possibilities of editing the predicted thickness map obtained by the multidimensional linear regression method in the modes Edit grid with arrows (editing the grid along vectors) and Edit grid in contours (Editing the grid in outlines).
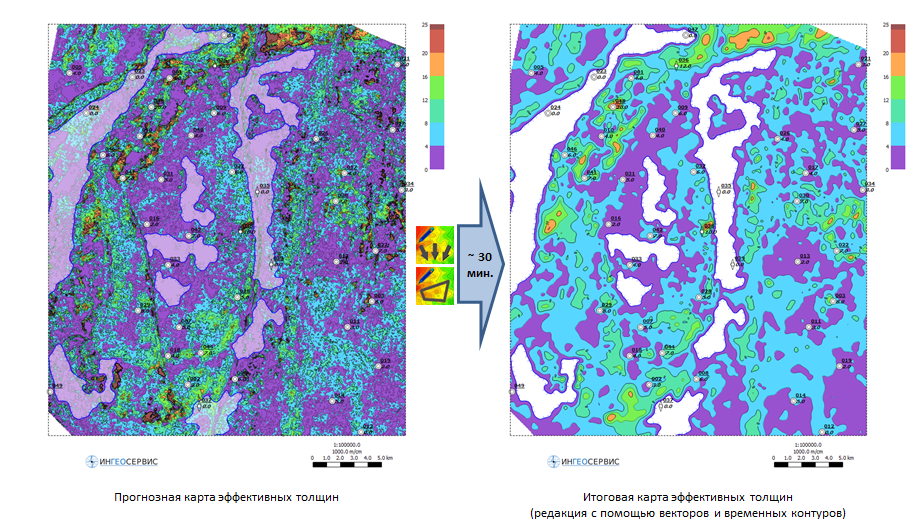
An example of editing a map of predicted net sand pay
Pie charts
In software IngeosMAP implements the ability to build circular pie charts. Any point object parameters can be used as parameters for calculating and pie charts building. Typically, pie charts display well test results (water/oil/gas), cumulative production in wells (water/oil/gas), net sand pay (water/oil/gas), thickness comparisons (actual/prognosis/delta) etc.

Pie charts
Point object interactive editing
Editing a point object is possible both explicitly – in the point object editor table, and interactively. The point object editor window is intended for editing the parameters of a point object and for setting well icons.
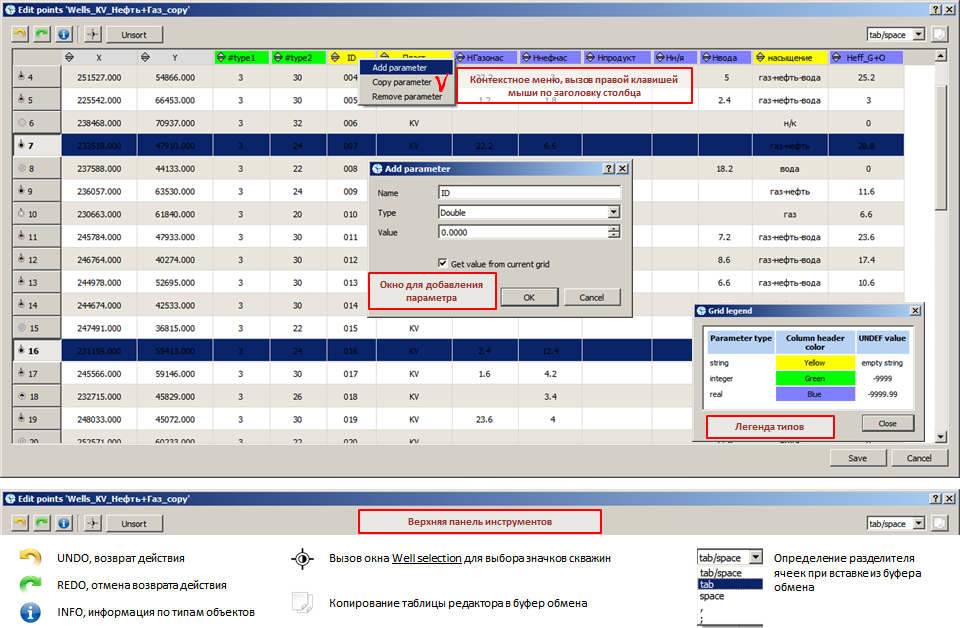
Point object editor window
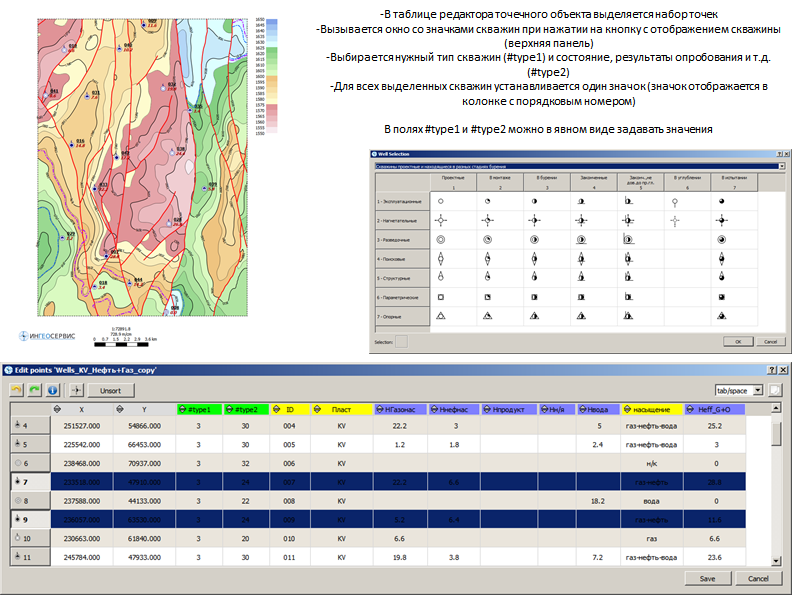
Set icons of wellsн
Operation with the line objects
Some procedures for operating with line objects presented below.
Calculation of the geometric center of lines and contours
As a result of the calculation, a point object is created with the name “Center of LineObjectName“, where LineObjectName is the name of the original line object, automatically placed at the top position of the object tree. The points of the created point object correspond to the coordinates of the contour centers (the arithmetic mean between the maximum and minimum coordinates value of the adjacent nodes), also, automatically, the Label and Value parameters corresponding to the name and value of the line/contour of the initial linear object are created. This procedure, as a rule, is used to visualize contour labels of licensed areas, fields, deposits, etc.

Calling the function for calculating the geometric center of the contours and the editor window of the created point object
Calculation of lines density in contours
As a result of the calculation, a point object is created with the name “Line density in contours LineObjectName“, where LineObjectName is the name of the initial line object, automatically placed at the top position of the object tree. The points of the created point object correspond to the coordinates of the contour centers (the arithmetic mean between the maximum and minimum coordinates value of the adjacent nodes), also, automatically, the Label and Value parameters are created, corresponding to the name and value of the line/contour of the initial linear object, and the Length, Density and Areaand the calculated. The Length value corresponds to the total length of the lines and contours displayed (the “eye” in the object tree is enabled) in the 2D visualization area inside the calculated contour. The Area value corresponds to the area of the original contour, the Density value is calculated by dividing the Length parameter by the Areaparameter.

Calling a function to calculate the density of lines in contours
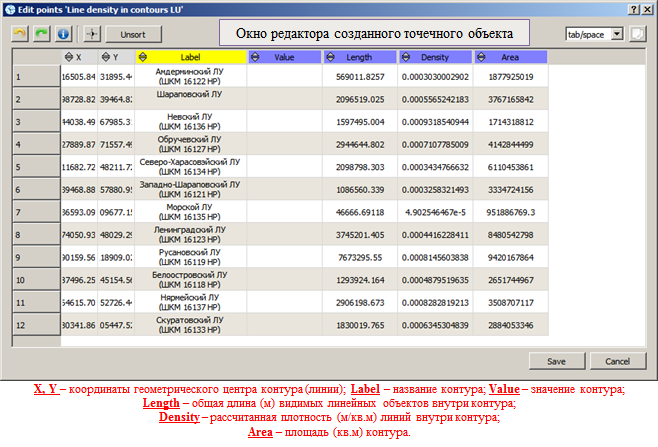
The editor window of the created point object with calculated parameters
Line editor window and interactive editing
The Edit lines line object editor window is called via the Edit object of context menu line object option. The editor window consists of a toolbar with function buttons and line options and three text fields. The left field displays a list of all lines of a line object, the name of which includes the total number of adjacent nodes of the line and the contour closed identifier “closed“. When a line is selected in this list, it is automatically selected in the 2D-visualization area of the main window of the software with the graphical parameters defined in the window default settings. The right field contains the coordinates of the adjacent nodes of the line selected in the left field. The lower field displays statistical information on the linear object, including information on the calculation of areas and volumes
.
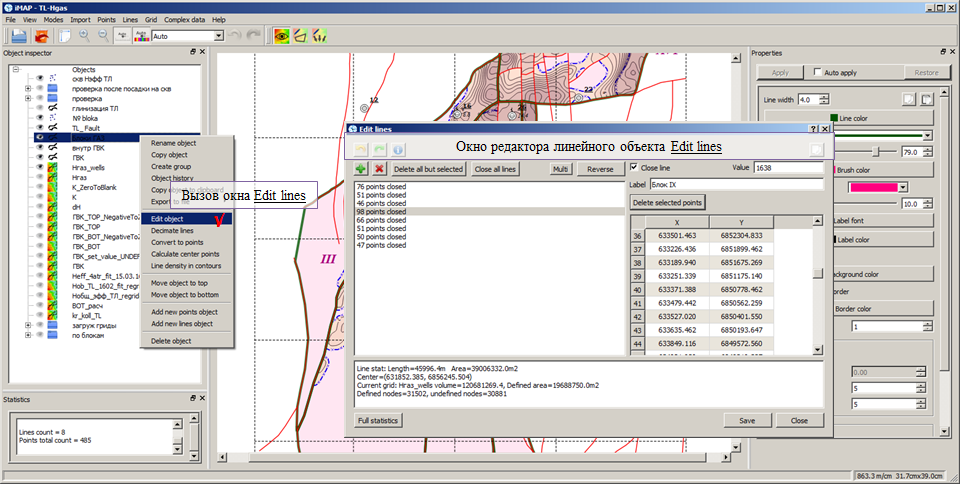
Calling the line object editor window Edit lines
Calculation of areas and volumes
The calculation of areas and volumes along contours is carried out through the editor window linear object. When selected in the list or interactively selected in the 2D line/contour visualization area its statistical information (line length, contour area, coordinates of the line center) is displayed in the lower field of the Edit lines
.
 Calculation of area and volume by selected contour and grid object
Pressing theFull statistics button opens a chart with geometric parameters for all contours of a linear object. For each contour, the following parameters are displayed in the chart: index number, name and value of the contour, length and total area of the contour, coordinates of the central point, volume, defined (with values) area, number of defined and undefined cells of the grid object selected in the object tree. Integral information is also provided for all contours of a linear object.
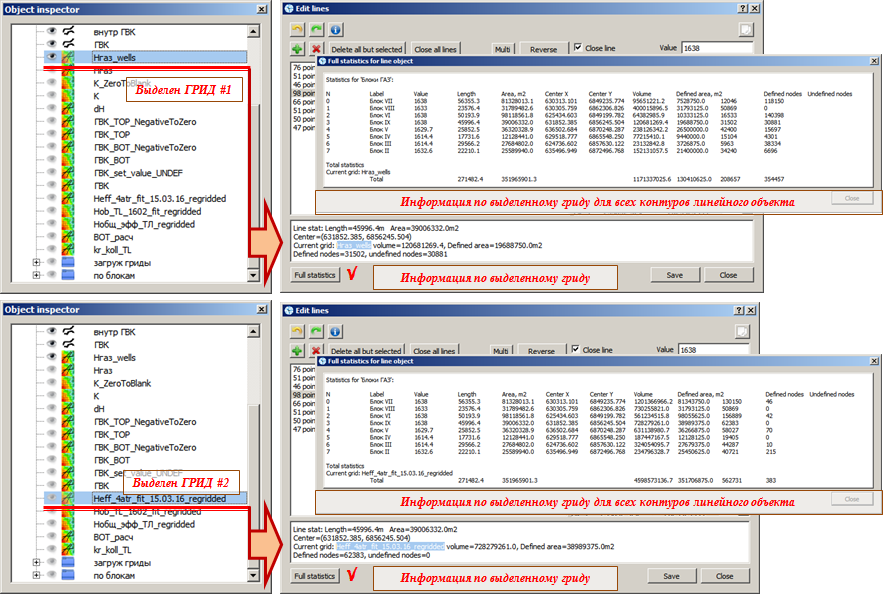 Calculation of area and volume by selected grid object and all contours of a linear object
Operation with spaced grids (grids)
This section provides information on operating with grid objects. Contents of a section of the reference guide for operating with grid objects is given below:
–General information on grid data (grids);
–Visualization options;
–Context menu;
–Conversion of isolines to a linear object;
–Data interpolation;
–Mathematical operations;
–Quick math operations;
–Frequency decomposition;
–Change of geometric parameters;
–Regriding (recalculation from one grid to another);
–Setup values in grids by contours;
–Faults setup;
–Calculation of distances to faults;
–Calculation of distances to linear and point objects;
–Density grid of linear objects building;
–Grid of the the number of hits in the contour building;
–Recalculation by segmented linear dependence;
–Smoothing;
–Calculation of gradients;
–Validation method for structural buldings;
–Automatic (local) tying on wells;
–Automatic (local) grid tying on contours/lines;
–Similarity maps building.
Data Interpolation
Before starting interpolation in automatic mode, data filtering takes place, after which a message appears in front of the user about the amount of filtered data, i.e. those points that will not participate in the interpolation process. During the interpolation process, the progress of the task is displayed in percentage terms, to cancel which the user must click on the Cancel button. When building a equally spaced grid, a window appears with a preview of the resulting grid, to save it in the object tree click the Save button.
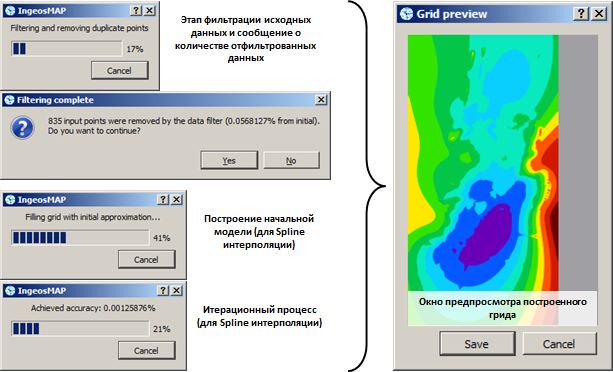
Progress of the process for Spline data interpolation
As an example, the result of interpolation of data on a equally spaced grid along five 2D seismic profiles, two of which are subparallel to each other with an apparent time depth mistie, is given. The first calculation is given without filtering, the second one with.
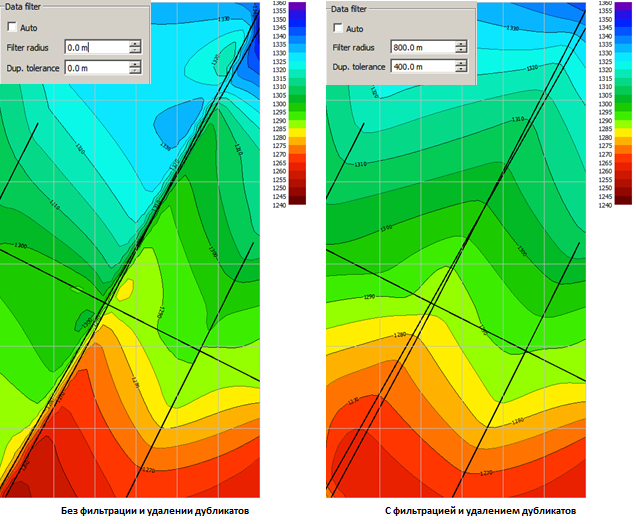 The result of applying the filtering of the initial data during interpolation
The following types of interpolation are implemented in the IngeosMAP software:
–Nearest Neighbor (nearest neighbor method);
–Inverse Distance (inverse distance method);
–Radial Basic Function (method of radial basis functions);
–Spline or Smoothing Spline (spline or smooth spline);
–Natural Neighbor (nearest neighborhood).
Math operations with grids
Mathematical operations with grids are presented in the program in a standard way. Math operations support ECMAScript syntax (ECMA-262 standard).
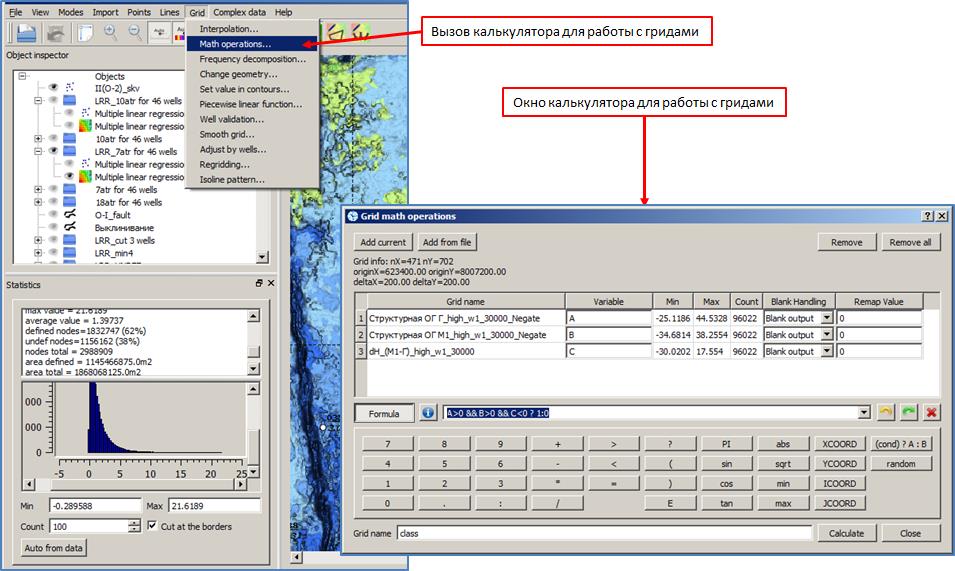
Calling the window Grid math operations
Quick math operations
The most commonly used math operations can be applied by calling the Instant math operations option of the grid context menu. The software provides quick operations shown in the figure below.
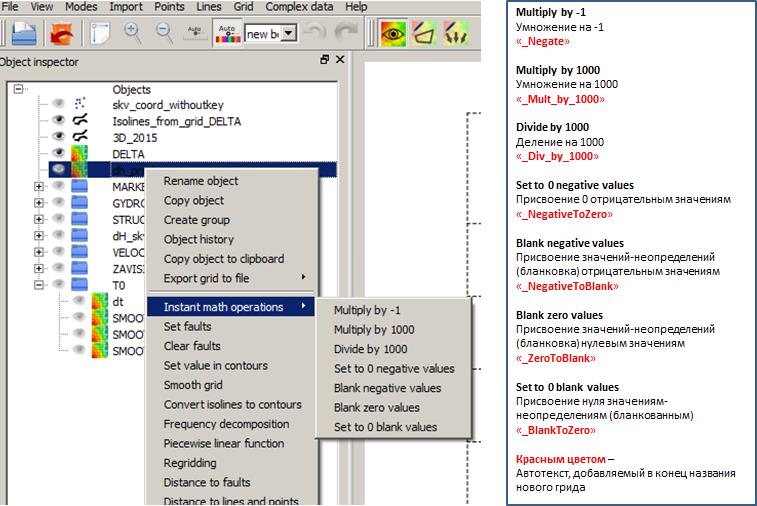
Calling “quick” operations from the grid’s context menu
Frequency decomposition
Frequency decomposition is the transformation of signals in order to change the ratio between their various frequency components. Filters provide the extraction of useful information from a mixture of an information noisy signal with the required indicators. The main task of choosing the type of filter and its calculation is to obtain parameters that provide the maximum probability of detecting an information signal against the background of noise.
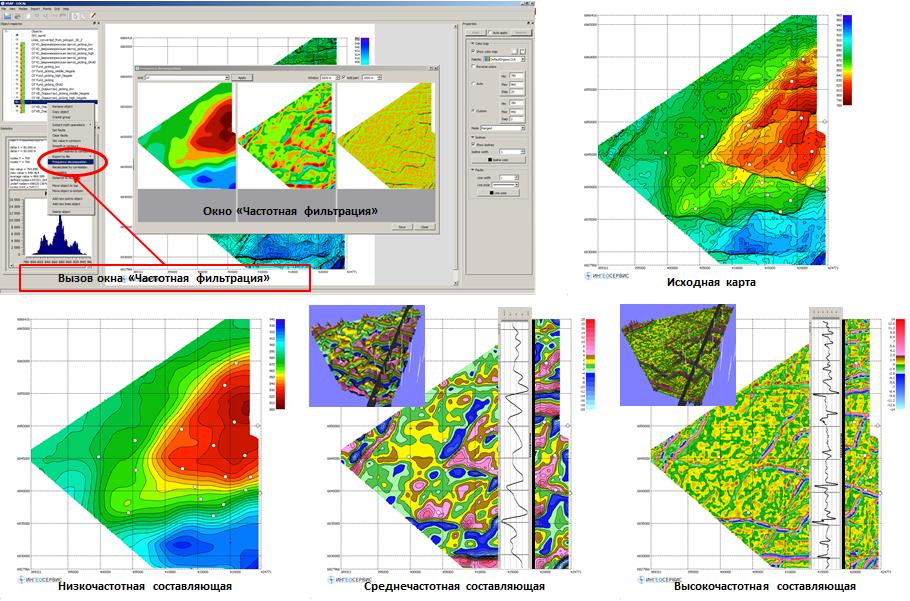
General scheme of grid decomposition into components
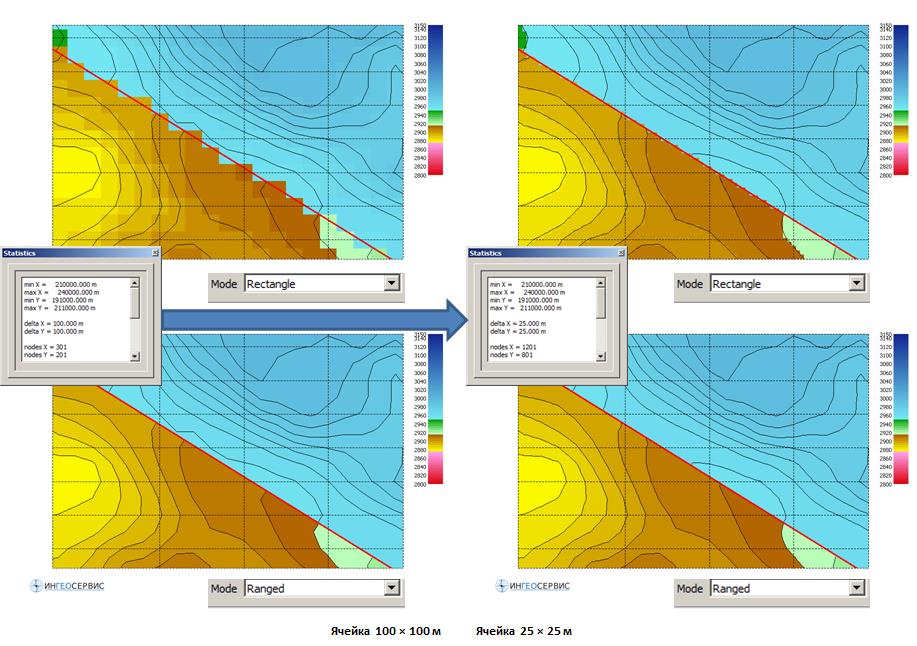
Regriding (recalculation of the grid from one grid to another)
When there is more than one source of input data for building geological models, it is almost inevitable, every time, that the problem arises of recalculating different 2D grid data to a single geometry. In IngeosMAP software a single grid geometry is required for calculating mathematical and logical operations, for crossplots building of the Grid/Grid type, etc. The process of converting grids to a single geometry can be divided into two stages. The first is change geometry, i.e. reduction to common areal units of measurement. If one grid is set in meters, the other in kilometers, it is important to match them. If both grids are in meters, but one of them contains the zone number in the X coordinate, and the other does not, you also need to make an appropriate correction in one of the grids. The second stage is regriding, i.e. changing the grid (geometry of adjacent nodes) of the grid. The automatic regriding calculation algorithm takes into account the geometry of the fault lines.
Setting grid values by contours
The Set value in contours window is intended for defining grid values inside (outside) contours, along fault lines and along the grid definition boundary. The following options are possible in the software: Inside – a constant value (or UNDEF) is set inside all contours of a linear object; Inside (contour value) – inside the contours, the Value values are set, which are defined in each of the contours. Outside – set a constant value (or UNDEF) outside all contours of a linear object; At borders – assigns a constant value (or UNDEF) to all cells of the grid object, the distance from the center of which to the nearest cell with an undefined value, or to the border of the grid, is less than the area size specified in the area size field. Around faults – a constant value (or UNDEF) is set in all cells of the grid model, the distance from the center of which to the faults is less than the area size specified in the area size field. The following are examples for each of the options for setting values in the grid by contours.

An example of setting values in a grid by contours: the value definition area is Inside (contour value)
Calculation of distances to linear and point objects
When building a grid of distances to linear and point objects, a grid is created in which each grid cell is assigned a minimum distance either to a line (perpendicular) or to a point. As a result of the calculation, a new grid is created in the object tree with the name lines_distance. Distances are calculated to those objects that are currently visualized in the main program window.
 Grid context menu option for calculating distances to line and point objects
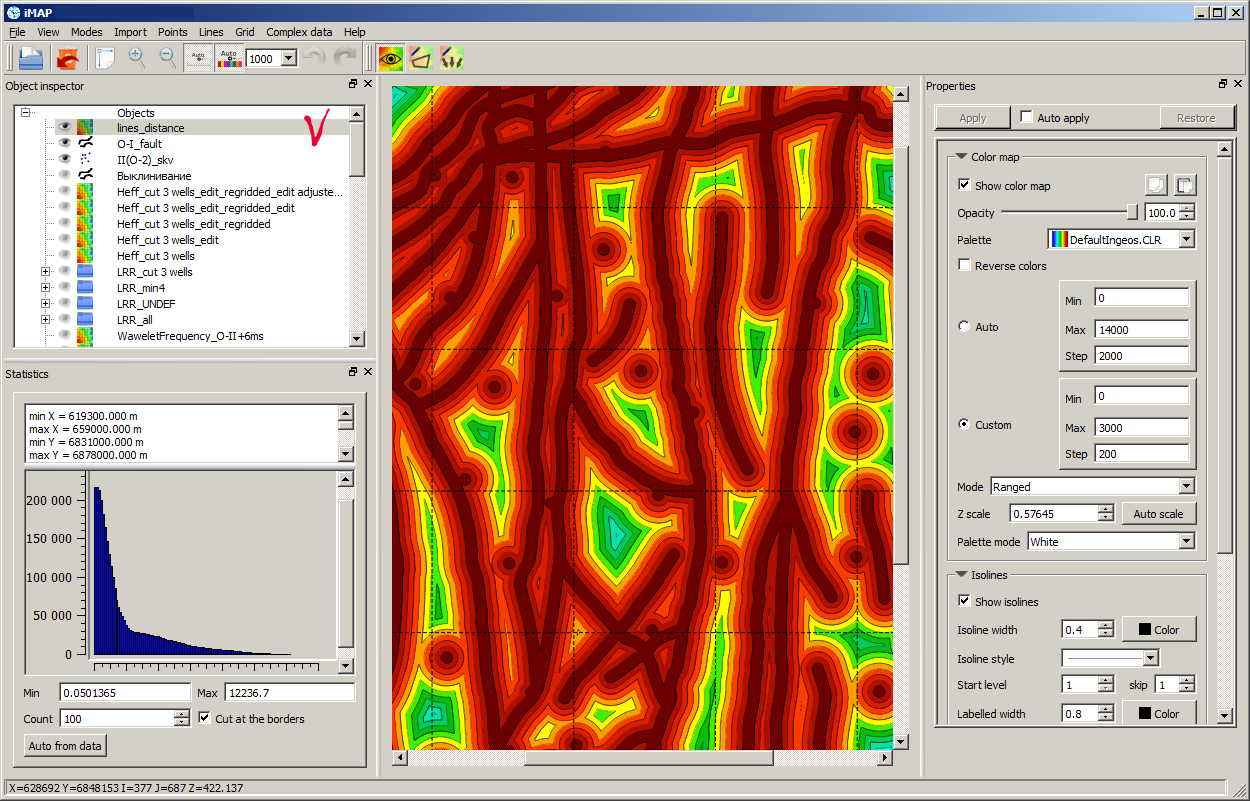
Calculated grid of distances to point and line objects
The parameter “distance to linear and point objects” can serve both to expand the feature space of the study area, and be used to solve such problems as: determining the degree of grid smoothing, obtaining contours with a given distance to objects, for example , water protection zones.To obtain contours (lines) of the same distance from objects, it is necessary to convert given isolines into a linear object.
Linear feature density grid building
The lineament density grid is calculated by selecting the Density of lines option from the context menu of any grid in the object tree. After that, a window opens for entering the size of the sliding window in which the density grid will be calculated. When you click on the OK button, the grid is calculated, which, with the name lines_density, is written to the top line of the object tree. The geometry of the newly created grid corresponds to the geometric parameters of the grid, from the context menu of which the option for calculation was called. This grid is not overwritten. Linear objects, the density of which is calculated, are all linear objects that are displayed in the object visualization window at the moment of calculation. Below is an example with the result of calculating density grids in sliding windows of 1000, 2000 and 4000m.
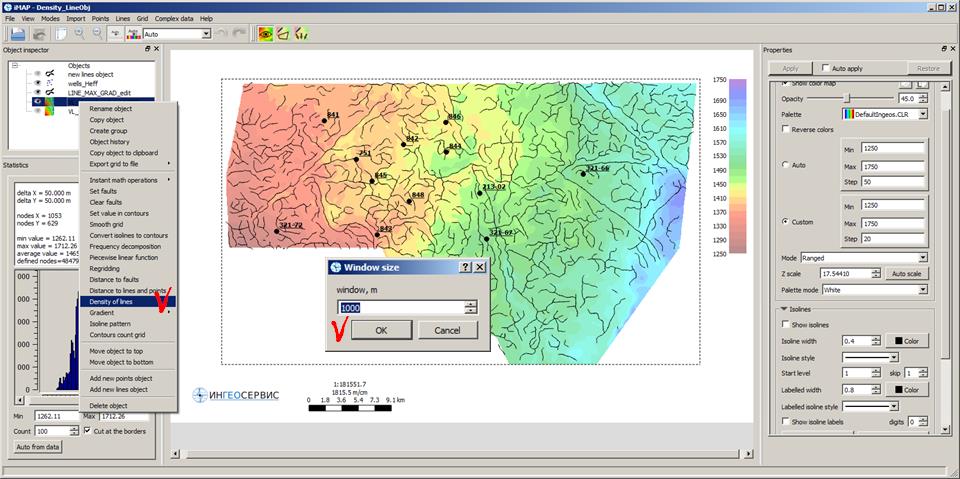
Grid context menu for calculating the density map of linear objects
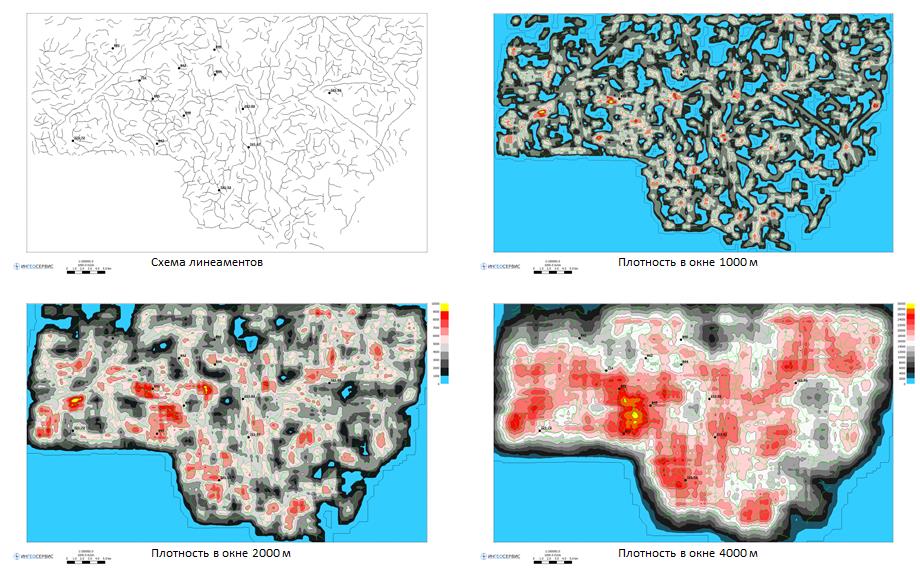
Lineament scheme and lineament density maps in different windows
Building a grid of the number of hits in the contour
When constructing a grid of the number of hits in a contour, a grid model is created, the values in the cells of which correspond to the number of hits in the given contours. Such a problem, in the general formulation, arises when it is necessary to identify the most prospective areas of the area based on the different origin of the contours of the anomalies. The figure below shows structural maps for the productive horizons of one of the fields and a summary scheme of the contours for all productive deposits. When building a grid of the number of hits in the contour, in this case, a grid model will be built, the values in the cells of which will correspond to the number of productive deposits.

Structural maps for productive horizons and a summary scheme of the contours of deposits
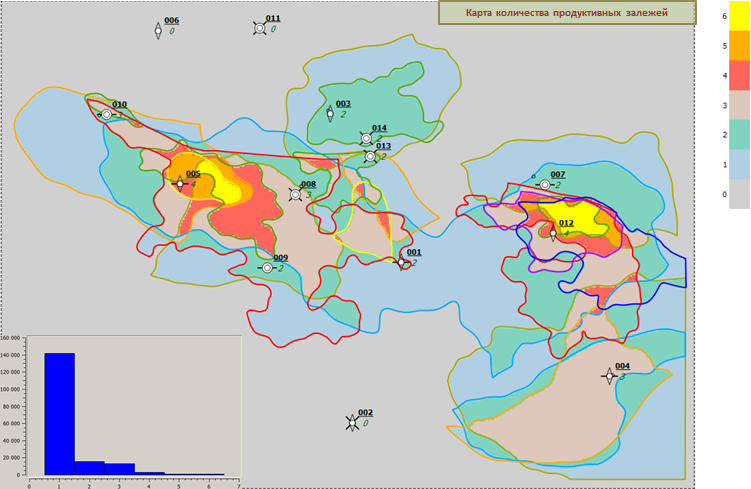
Grid model Contours count grid corresponding to the number of productive deposits
Grid recalculation by piecewise linear function
Grid recalculation by piecewise linear function is carried out using the Piecewise linear function, window, which is called through the main menu option of the software Grid/Piecewise linear function, or through the context menu of the grid, in this In this case in the Grid field will be selected the active grid by default.
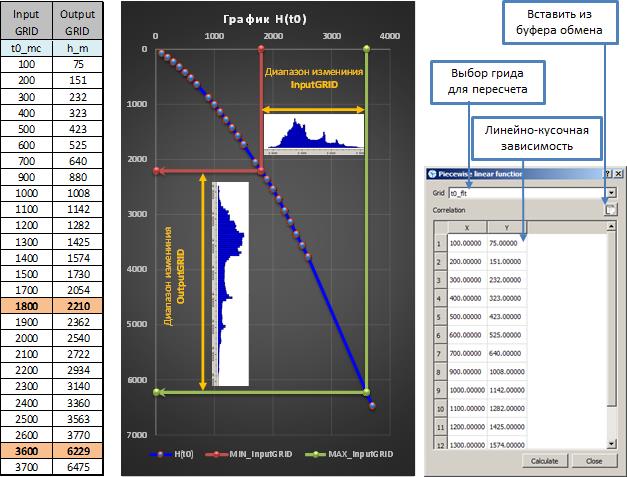
To the recalculation of the grid by piecewise linear dependence
Smoothing
The IngeosMAP software uses matrix smoothing, taking into account the geometry of fault lines (if any). For each grid point, a square with a given side length ( Window parameter) and a center at this point is considered, and all grid points that fall into this square are considered. To calculate the smoothed value, each grid point Pi that falls into the square is assigned a weight value wi. If we denote by vi the value of the grid at the point Pi, then the smoothed value is obtained by the formula:
![]()
Grid points that fall into the square, but with missing/invalid values, do not participate in any of the sums. In this case, the weight values can be chosen arbitrarily. If all wi = 1, then the result is simply the average of all squared values. The software uses weight coefficients equal to max(0, Window/2 – distance(Pi, center)). This set of wi weight coefficients is the same for all grid points. To take into account faults, another set of ci coefficients is introduced, each of which is equal to 0 if the segment from the point Pi to the center of the square (i.e., the point where the smoothed value at which computed) crosses one of the faults, or 1 otherwise. Taking into account these coefficients, the formula takes the following form:
![]()
The set of ci weight coefficients for all grid points is different.
Modern CPU’s contain several processing cores, and sometimes the cores can process two commands from the instructions stream in parallel.The smoothed value at each point is calculated independently of the other points, so the smoothing result can be calculated simultaneously for several points. To do this, several workflows are launched, each of which processes its own grid points. A separate flow is responsible for distributing grid points among workflows. Its task is to support uniform loading of workflows (so that they finish working at the same time) and user interaction (progress report, cancellation). According to the results of testing on a processor with 4 cores, each of which is capable of processing 2 instructions in parallel, the smoothing time decreased by 6 times.
Grid objects (grids) can be smoothed in the software in two modes. ПThe first is grid smoothing using the Smooth grid window to smooth the grid, the second is local smoothing when operating in the temporal contours mode.The window for smoothing the grid is called either through the main menu Grid/Smooth grid…, or through the context menu Smooth grid of the corresponding grid. When calling the window for smoothing a grid, the following smoothing options are available:
- smooth the entire grid in the window with the same radius;
- smooth the entire grid with arbitrary window size for each cell (the window is set by the grid);
- local smoothing inside (outside) closed contourslinear object;
- local smoothing along the lines of a linear object;
- smoothing along faults;
- options for local anti-aliasing;
If there are faults in the grid object, smoothing always takes them into account.
Grid smoothing along faults
Below is an example of smoothing a grid along faults:
Initial grid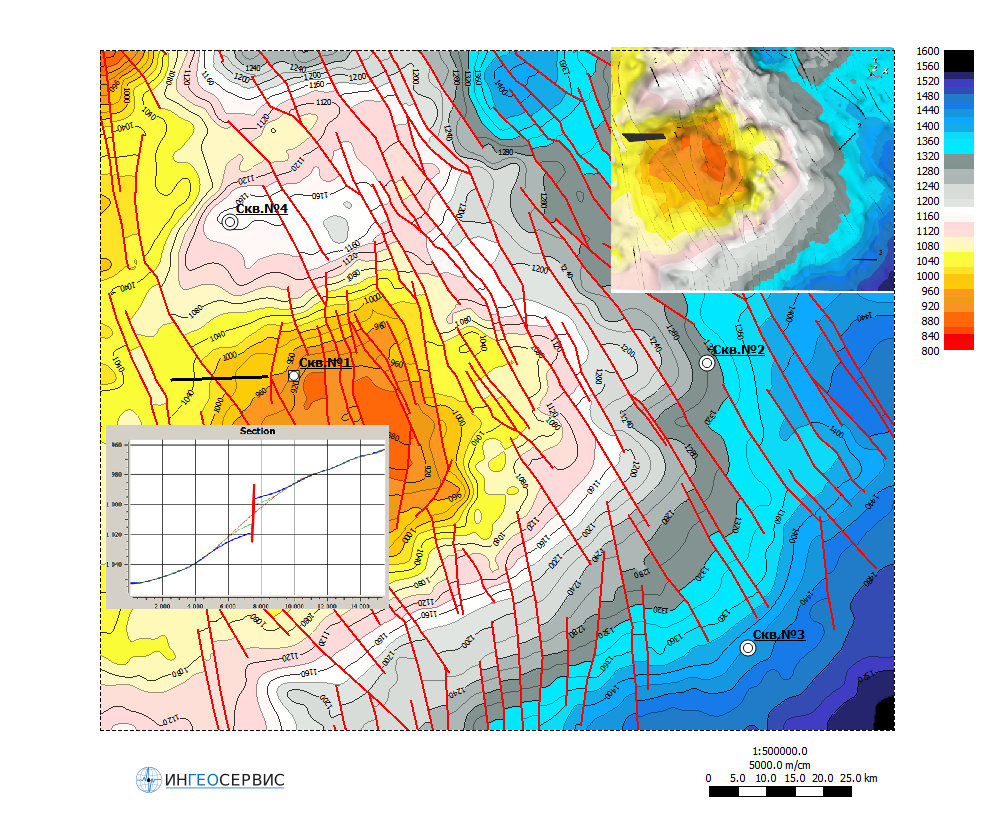
Smoothing result with Window=6000 and Stitch dist.=3000
Difference between original grid and smoothed along faults with Window=6000 and Stitch dist.=3000
Parameters for local smoothing
When smoothing inside (outside) contours, inside (outside) temporal contours, along line objects and faults in the software smooth stitching of smoothed fragments with an unchanging grid area is implemented.
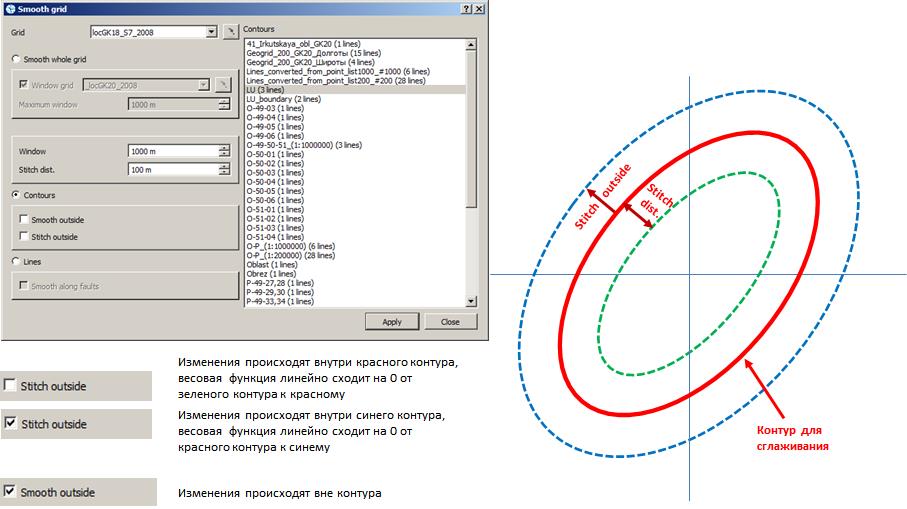
Flow chart for smoothing a grid inside contours and along lines
Parameters for smoothing are set either in the Smooth grid window, designed to smooth the grid inside (outside) contours, along linear objects and faults, or to the corresponding fields located on the toolbar of the main window of the software. The latter are available to the user in the grid editing mode in temporal contours.
![]()
Defining smoothing options on the toolbar in grid editing mode in time contours
The following are examples of smoothing along lines and inside contours:

Smoothing along the line with Window = 10000 and Stitch Dist. = 10000
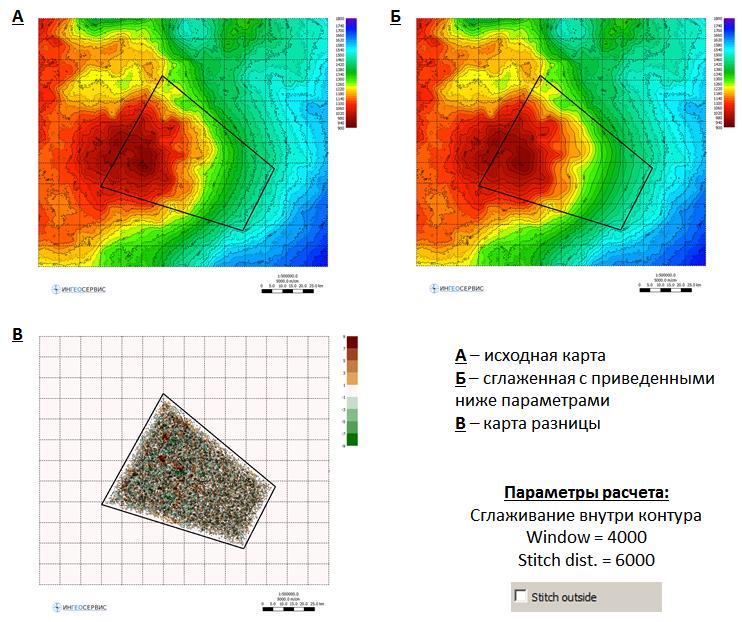
Smoothing along the line with Window = 4000 and Stitch Dist. = 6000 (Stitch outside disabled)

Smoothing along the line with Window = 4000 and Stitch Dist. = 6000 (Stitch outside enabled)
Calculation of gradients
To calculate horizontal (X-axis), vertical (Y-axis) gradients or full grid gradient module, the user must select the Gradient/-> option from the context menu of the active grid and, further, the type of gradient to be calculated: Horizontal gradient, Vertical gradient, Full gradient module. The gradient grid is automatically calculated and added to the top position of the object tree. The name of the newly created grid, depending on the selected calculation option, will look like this: Horizontal gradient for grid ‘Name’, Vertical gradient for grid ‘Name’, Full gradient for grid ‘Name’, where Name is the name of the initial grid.

Examples of calculation of horizontal, vertical and full gradient module.
Validation method for structural buildings
The well validation method is used, among other things, to check and evaluate the accuracy of structural buildings. The input data are a equally spaced grid of time depths and TVDSS defined at the points of reservoir intersection of the wells.
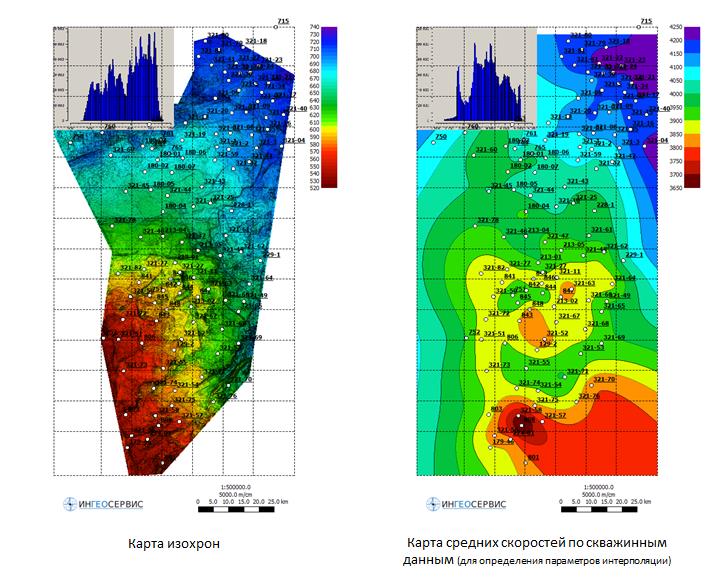
Time-structure and average velocity maps (to determine interpolation parameters)
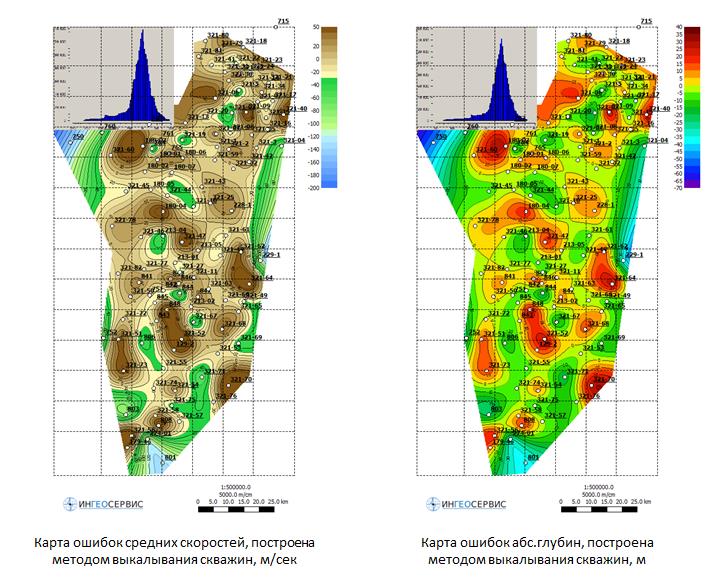
Error maps of average velocities and depths built by the validation method
Automatic (local) tying on wells
Automatic tying on wells s one of the algorithms for correcting a 2D grid model (structure surface, thickness map, petrophysical maps, etc.), associated with matching the grid with well (point) data. Not in every case this approach is optimal, which depends on the organization of the source data. Unlike interpolation of point data, where a representative amount of data is used simultaneously in the calculation, this mode is a sequential processing of each well separately.
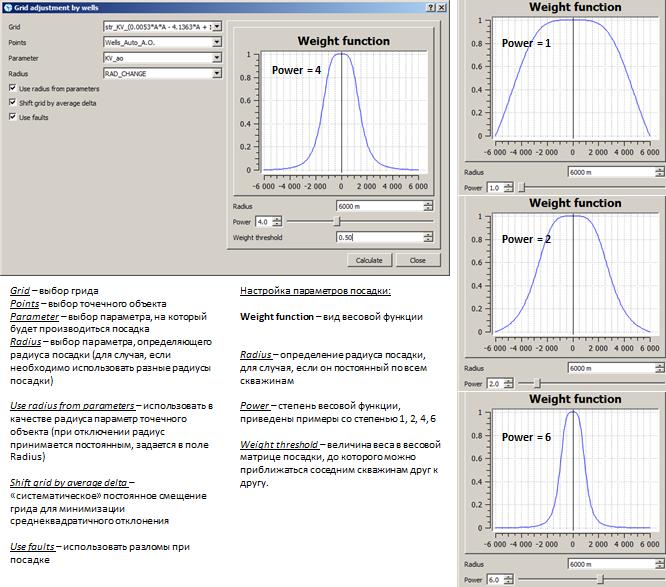
The window for automatic tying on wells and the type of weight function for calculating the mis-tie
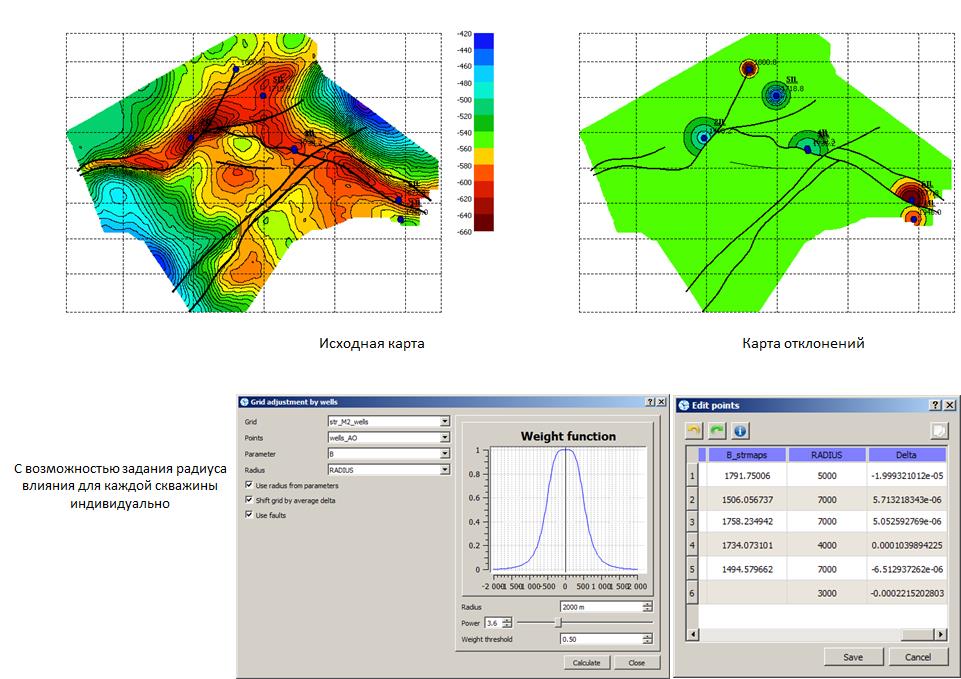
Automatic tying on wells (tectonics, small number of wells, different tying radius)
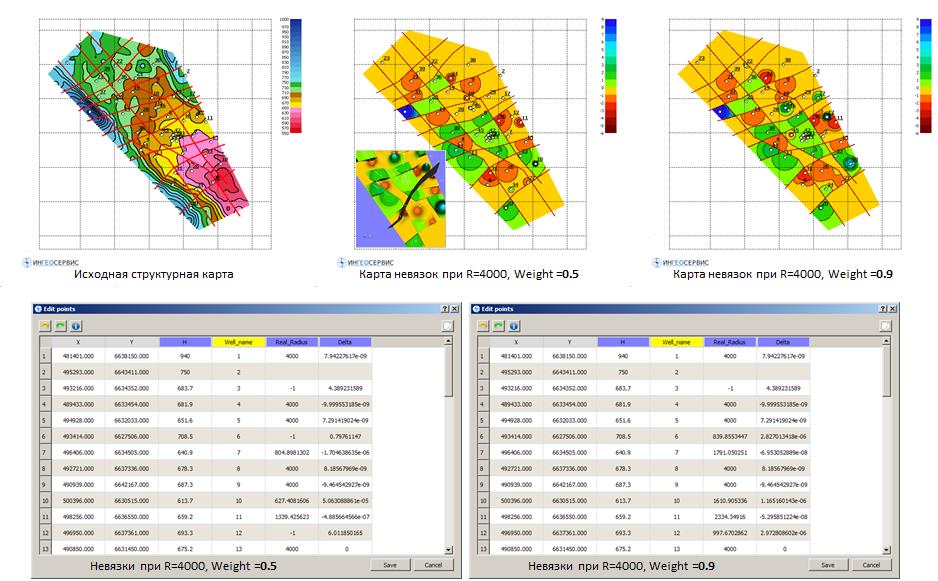
Automatic tying on wells (block structure)
Automatic grid tying on contours/lines
Automatic grid tying on the contours and lines of a linear object is another algorithm for correcting a 2D grid model (structure surface, thickness map, maps of petrophysical parameters, etc.) associated with adjusting the grid in such a way that the corresponding isoline passes strictly along the line, defined at the input in the linear object. This algorithm is applicable for solving the following tasks: bringing the structural plan in line with the previously defined contact contour (GWC, GOC, etc.), correcting the pinch-out line of the thickness map, bringing the porosity map to the boundary value on the replacement line, etc.
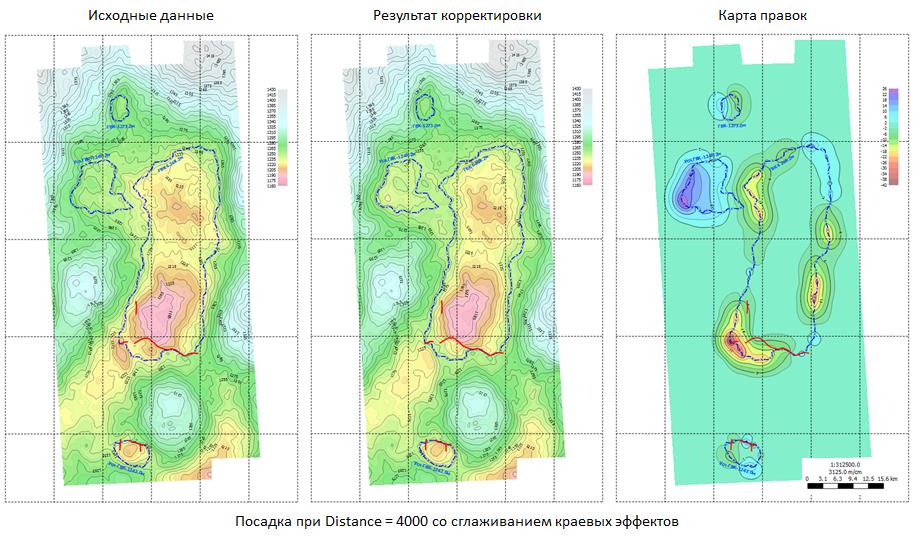
An example of automatic grid correction by contours
Similarity map building
This algorithm is based on the assessment of the measure of the feature’s spatial connection, which manifests itself in the nature of the isolines display – direction and frequency, with the standard object. An area described by an ellipse is set as a reference.
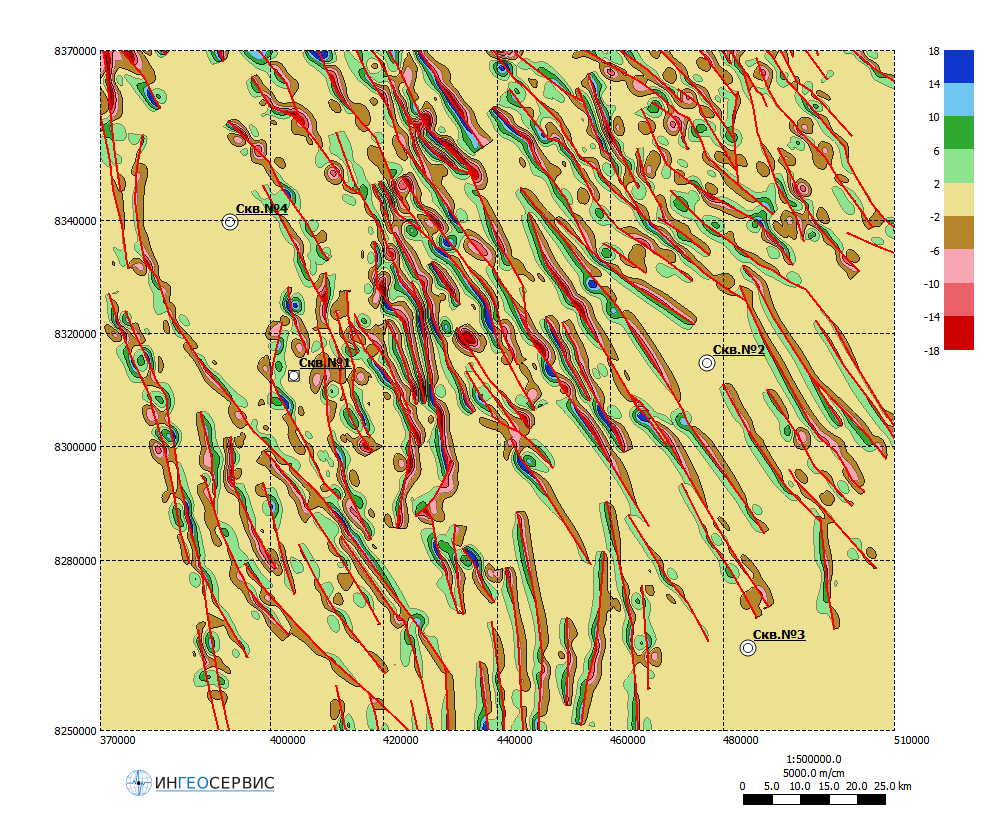
The following is an example of a similarity map building for one of the discovered fields in Eastern Siberia, located in the western part of the area, with two gravity field transformants. For each transformant, similarity maps with the standard area shown in red were calculated independently of each other. The calculated maps show a good similarity with another discovered field located in the eastern part of the area. Based on two similarity maps, the final similarity map was calculated as the arithmetic mean, i.e. with equal values. Thus, depending on the physical meaning of one parameter or another parameter and the task being solved, иthe final building of a similarity map can be made on the basis of an arbitrary number of calculated similarity monomaps with different or identical values.

Similarity map building for two transformants of the G-field.
Cross-plots
Cross-plots are one of the most visual ways to present not only the initial data, but also the results of the work. The main goal of building crossplots is to search and test existing hypotheses and ideas, but visualization, competent justification and interpretation of the patterns obtained is one of the main tasks of a geologist or geophysicist-interpreter. The IngeosMAP software provides the ability to build crossplots both by a bunch of objects Grid/Grid, and by a pair of two parameters point objects</u >.
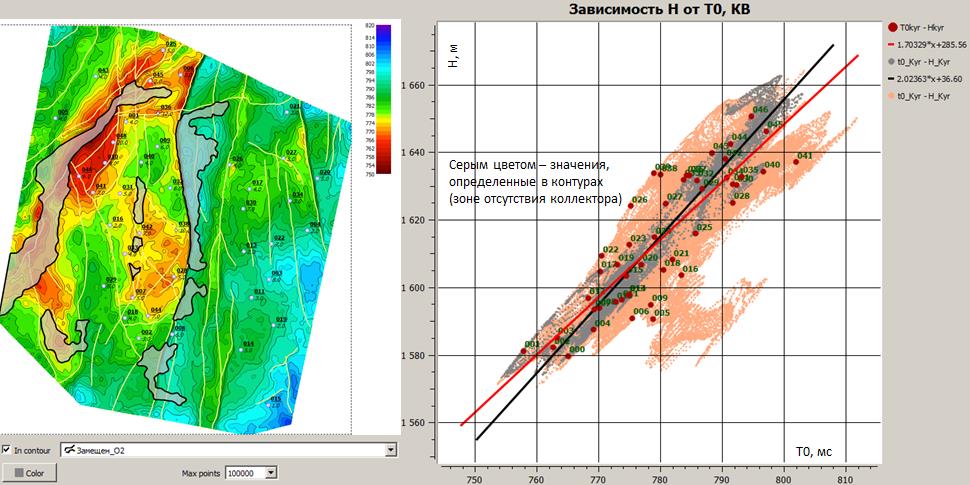
Crossplot building based on points defined inside contours

Selecting data on a crossplot and displaying it on a map for a Grid/Grid pair

Points exclusion when point data analyzing
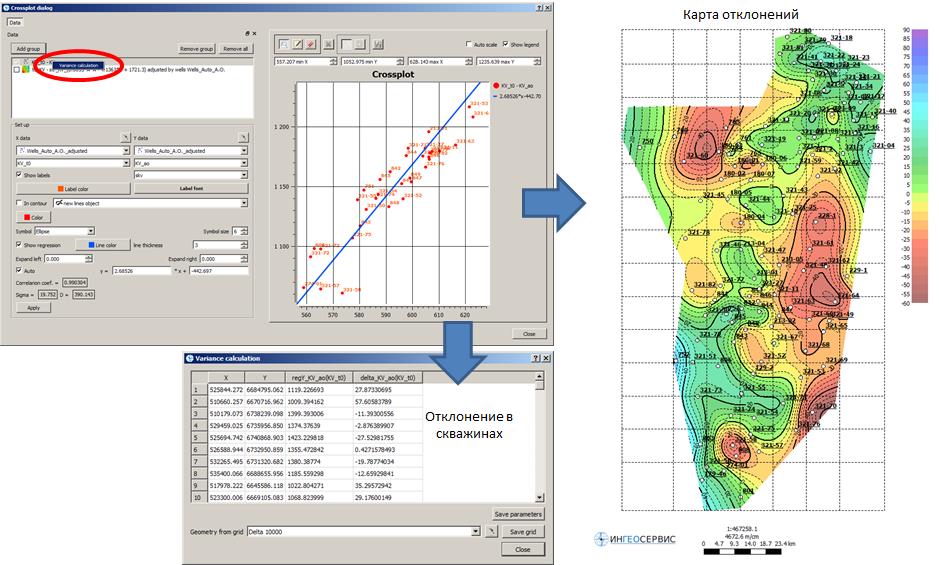
Automatic deviations map building when a cross-plot building
Axonometry and schematic sections building
For a more substantive analysis of objects, a three-dimensional visualization of grids has been implemented with the ability to build a section along an arbitrary line. Below the Grid section software’s window for 3D visualisation and sections building presented.
This window, called via the main menu option of the View/Cross section… program, includes 4 main panels. The first is a list of grids for visualization in the 3D window, with the ability to disable / enable the display of the object. The second one is intended for selection of displayed elements in the 3D window and the window for section’s building (seismic line, wells) and their graphical properties. Also, the Grid section software window includes graphical panels for 3D data display and for building a section along a given section.
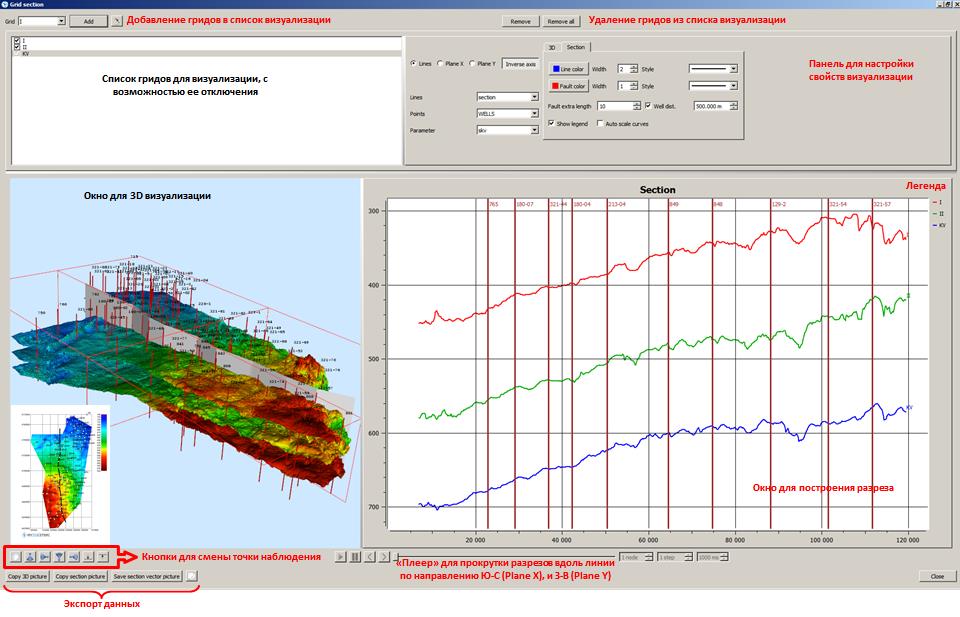
Grid section window for 3D visualization and sections building

Defining a line for section building
In the modes of a section builing along the X or Y axis (Plane Y, Plane X), a player is activated under the panel for displaying the section to control the graph.
![]()
Player for scrolling sections
When operating with the Grid section window for 3D visualization and section building, the synchronous cursor function is implemented. This means that if the mouse position is in the visualization area of the 2D map, then the current mouse position will be displayed in the 3D visualization window and on the section, if the mouse position is close to the position of the seismic line on which the section is built. And, if the mouse position is in the section building window, then this position is displayed both on the map in the 2D building window and in the 3D visualization window. The following are examples of displaying a synchronous cursor.

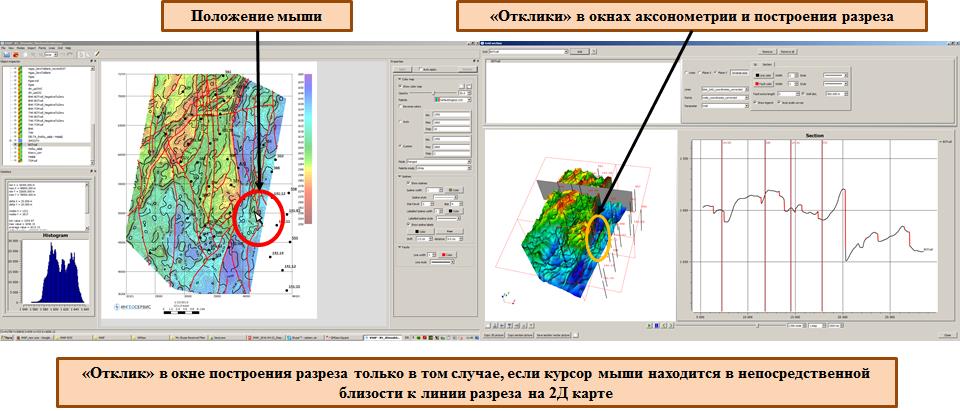
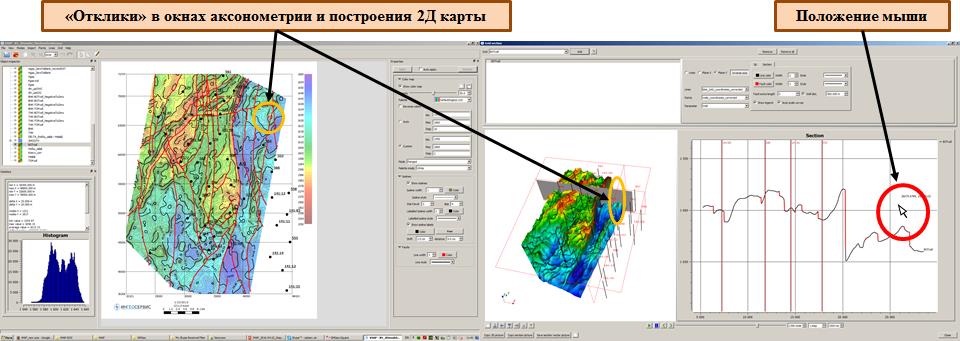
Synchronous cursor of 2D window, 3D visualization window and section building window
Integration of geological and geophysical data
In current version of the IngeosMAP software implements the following features:
- building a classification map for two grid objects with the class matrix building to solve the tasks of zoning and contouring the most prospective zones (target);
- multiple linear regression to obtain the areal distribution of the predictable defined in the well data.
Classification with the building of a matrix of classes by two grids
When analyzing geological and geophysical features (structural surfaces, thickness maps, petrophysical characteristics, transformants of potential fields, etc.), the problem often arises of highlighting anomalies of one feature against the background of another. For example, against the background of uplifts of the structural plan, the identification of zones with reduced total thicknesses or the identification of zones of increased effective thicknesses with better reservoir properties. Similar tasks are solved on the basis of distribution parameters histograms building, followed by the class matrix building and a class map.
Further, for this example, input features for building a classification map are given – a structural map for RH A (Grid 1) and a map of local component for the top of the Jurassic complex, as well as a map’s classification calculated, consisting of 16 classes. The first class, shown in burgundy, is defined in cells that have the minimum values of both the first and second parameters; class No. 16, on the contrary, is defined in cells in which the maximum values of the two input parameters.
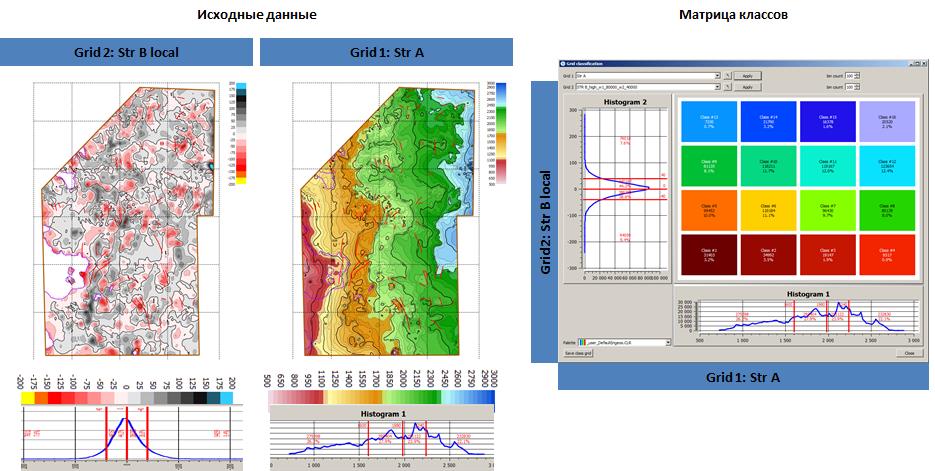
Initial data and class matrix for building a classes map
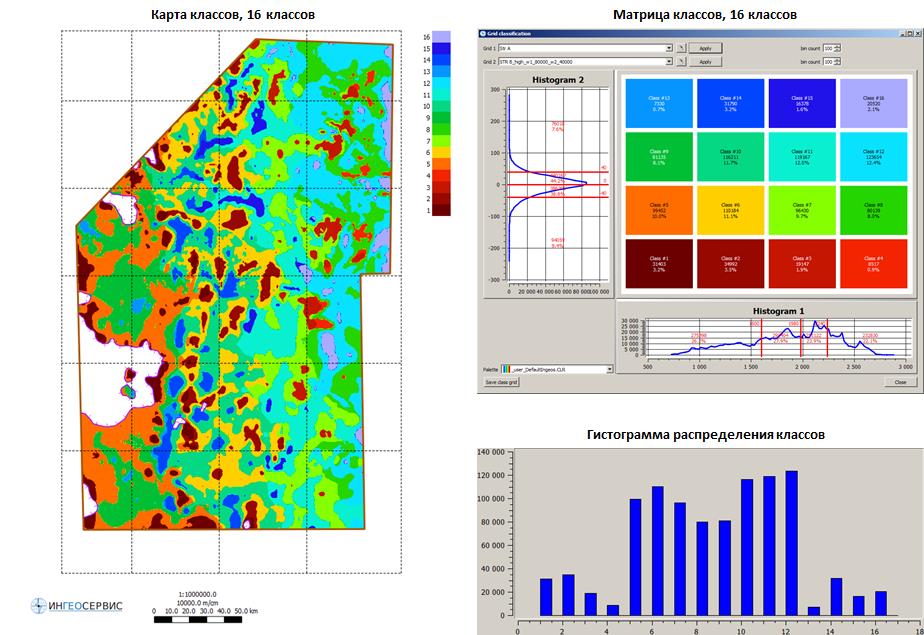
Map of classes according to the data of the structural surface according to RH A and the local component according to RH B
Multiple linear regression
In the IngeosMAP software. the Multiple linear regression window for calculating multiple linear regression is called through the Complex data/Multiple linear regression… submenu of the main menu of the software. In the Points field, a point object with standard points is selected from the drop-down list. In the Point values field, the user must define the predicted parameter (standard) of the point object. The line below displays information on this parameter: the number of points, the minimum and maximum values of the parameter.
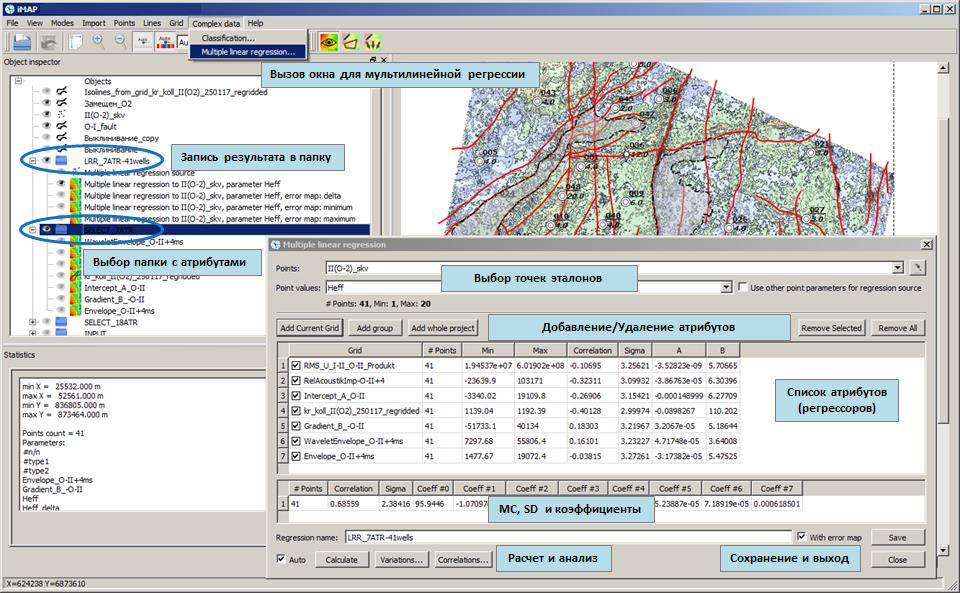
Multiple linear regression window
For each attribute, the list displays the following parameters: the number of points, the minimum and maximum values at these points, the correlation coefficient and standard deviation of this attribute with standard values, as well as the A and B coefficients included in the equation Y = A*X+B, where Y – predictive parameter, X – regressor. Also, additional parameters of a point object, in which standard points are defined, can act as regressors. When the Use other point parameters for regression source checkbox is enabled, all parameters of the point object specified in the Points field will be displayed in the list of attributes (regressors). To calculate a multiple linear equation, the user must click on the Calculate button, which is located in the lower left corner of the Multiple linear regression window. In the bottom table will display the results of the calculation: the total number of points involved in the calculation of the equation, the multiple correlation coefficient, the root mean square error, and the regressor coefficients. If the Auto option is enabled – a checkmark to the left of the Calculate button, then the calculation of the multiple regression parameters will occur automatically after each change in the list of regressors (adding / deleting a regressor, temporarily excluding a regressor from the calculation, change in the predicted parameter).
The Save button located in the lower right corner of the window is used to save the calculation results. When pressed, the calculated parameters of the multiple linear regression are saved in a new point object. If the regressors are defined as grids, a new grid is calculated from the multiple regression equation and a preview window opens. In this case, to save the result in the project, i.e. placing it in the object tree, the user must click on the Save button of the preview window. After that, a folder with the name specified in the Regression name field of the Multiple linear regression window will be created in the object tree.
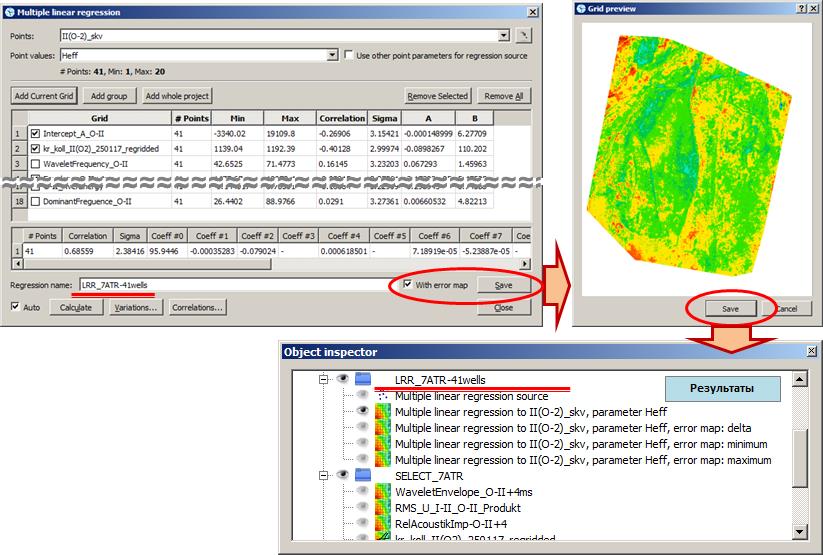
Saving the results of a multiple regression calculation
Multiple linear regression window
The created folder contains a point object called Multiple linear regression source, which contains all the data from the point object defined in the input step in the Points field, plus the results calculation. Further, in the folder with the results of the calculation, there is a grid with a predictive parameter. Its name contains the names of the point object and the parameter that have been defined as standards. The predicted map, as a rule, requires additional correction. It can include reduction the map in line with well data, correction in the inter-well space, elimination of contradictions with adjacent data. When the With error map, located to the right of the Save button of the Multiple linear regression window is enabled, variation chart of uncertainty estimation is calculated and saved in the results folder (…error map: delta) by the successive well’s delition method. When each predicted map is building, at the first stage, the number of variants of predictive indicator of distribution map corresponding to the number of wells is built. When each predicted map is building, one well is eliminated and multiple linear regression coefficients are recalculated. At the second stage, having received a set of distribution maps of the predictive parameter, maps of the minimum (…error map: minimum) and maximum (…error map: maximum) values of the predictive parameter are built. By subtracting from the map of the maximum distribution of the parameter of the map of the minimum distribution, a map of variations is calculated.
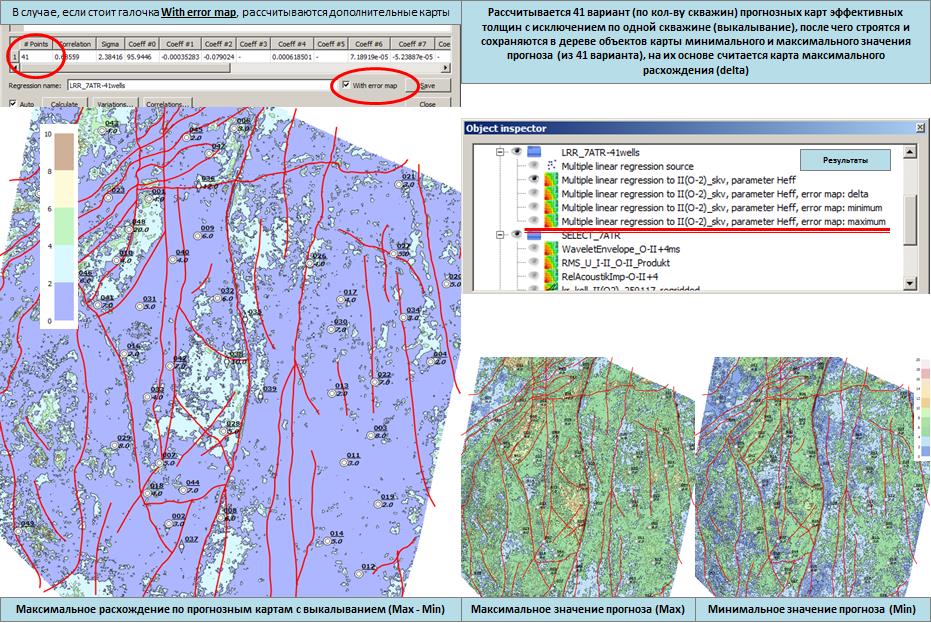
Построение карты вариаций изменчивости прогноза методом выкалывания
Ниже приведены инструменты для анализа входных параметров. При нажатии на кнопку Correlations… открывается окно Parameter pairwise correlations с парными коэффициентами корреляции входных атрибутов (регрессоров). В таблице розовым цветом выделяются ячейки с коэффициентами корреляции парной связи более 0.5. Строками с серым шрифтом отображаются рассчитанные параметры для отключенных регрессоров (в списке входных атрибутов окна Multiple linear regression). Также, в данной таблице, для каждого из регрессоров приведены коэффициент корреляции, среднеквадратичное отклонение с точками-эталонами (такие-же, как в списке входных атрибутов окна Multiple linear regression) и коэффициент Хельвига. Коэффициент Хельвига – индивидуальная емкость носителей информации: hj = Rj2 / (1+ |Rij|), где j и i = 1,2, … m, Rj – коэффициент корреляции между j-м входным атрибутом и объясняемым эталоном. Rij – коэффициенты корреляции между атрибутом Xj и остальными атрибутами Xi, входящими в состав рассматриваемой комбинации признаков.
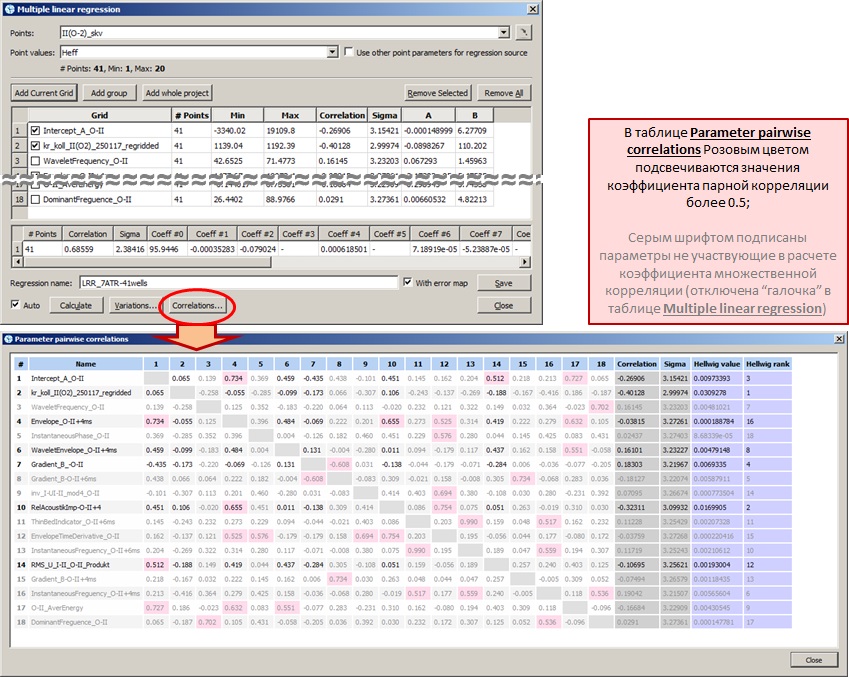
Определение парных коэффициентов корреляции входных атрибутов
Окно Parameter/point variations предназначено для расчета коэффициентов множественной корреляции для всех возможных комбинаций, при исключении из расчета ряда атрибутов и точек-эталонов. В поле Variation method пользователь выбирает метод исключения данных. В программе представлены следующие методы:
1.Exclude parameter(s) and/or point(s) – расчет коэффициента множественной корреляции по всем возможным комбинациям при исключении ряда параметров-регрессоров и/или точек-эталонов;
2.Given number of parameter combinations – вычисление всех возможных комбинаций для заданного числа параметров и всех точек;
3.Given number of point combinations – вычисление всех возможных комбинаций для заданного числа точек и всех параметров;
Exclude parameter(s) and/or point(s)
Данный метод предназначен для определения наиболее оптимального количества атрибутов при расчете коэффициента корреляции множественной регрессии. Применение данного метода не отвечает на вопрос, сколько параметров нужно использовать, но предоставляет пользователю статистические показатели и динамику изменения при исключении одного или другого количества параметров, а также скважин-эталонов.
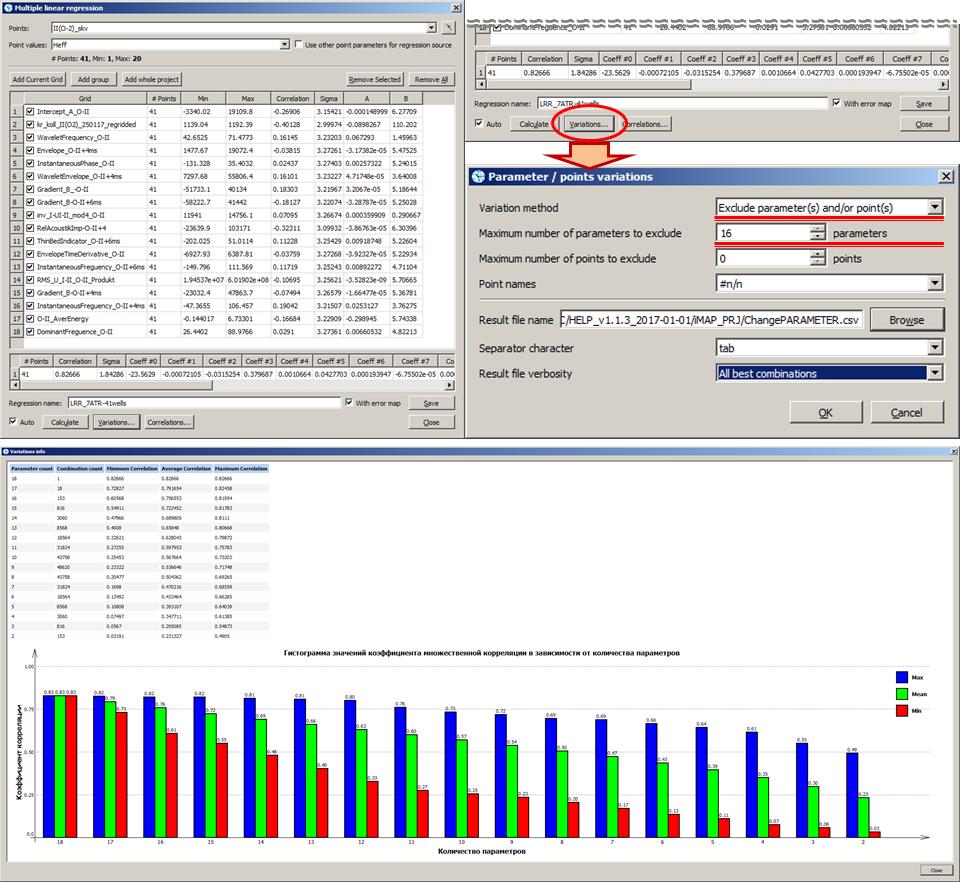
Результаты расчета при выборе метода Exclude parameter(s) and/or point(s)
При расчете комбинаций данного метода вариаций возможно также, наряду с параметрами, исключать из расчета и скважины-эталоны. Здесь следует учитывать тот факт, что при большом количестве параметров-регрессоров и скважин-эталонов расчет может занять определенное время. На рисунке ниже приведен пример с расчетом комбинаций только с исключением параметров регрессоров, до 16 параметров, а также, расчет комбинаций с исключением до 16 параметров и 1 или 2 скважин. Количество комбинаций в первом случае, составляет 262,125 (расчет длится несколько секунд), во втором – 225,951,750 (расчет длится десятки минут). Из примера видно, что исключение до 2 скважин (менее 5% от общего количества) при 7 параметрах позволяет увеличить коэффициент множественной корреляции до 0.77022, при участии в расчете всех скважин данный показатель был равен 0.68559. Но и комбинация из 7 параметров в данном случае уже другая, нежели при расчете со всеми скважинами. В таблицах внизу, на рисунках, выделены “лучшие” комбинации параметров и исключенных скважин (во втором случае), при которых получены максимальные коэффициенты множественной корреляции.
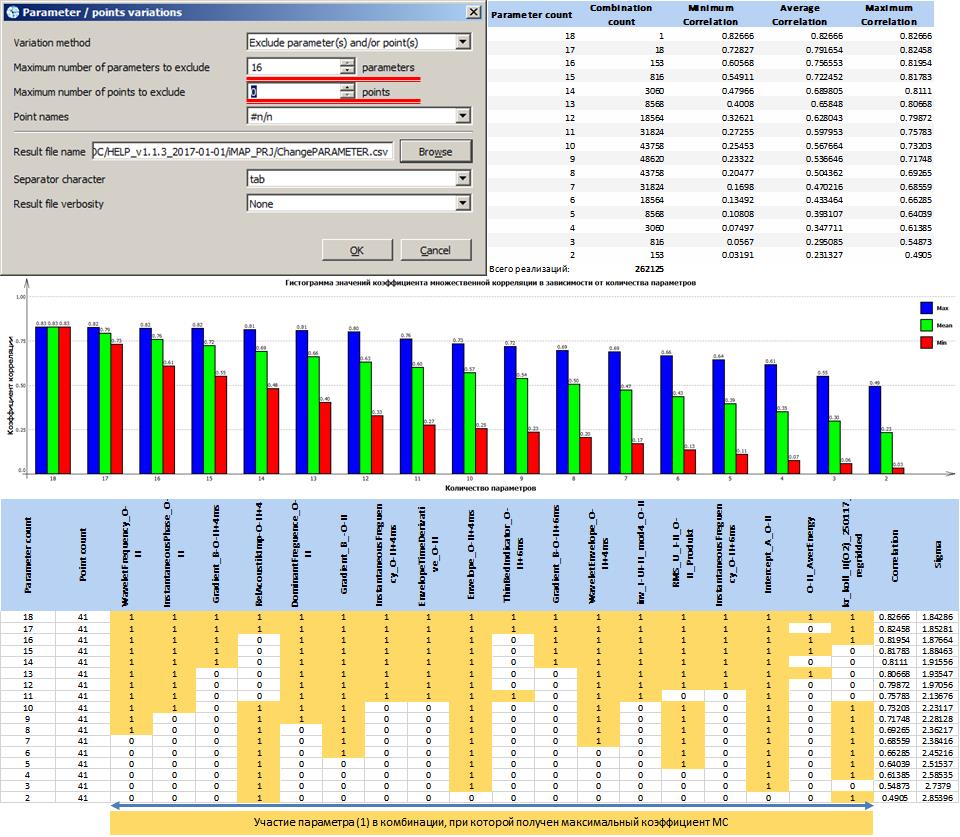
Расчет всех комбинаций с исключением до 16 (включительно) параметров и 0 точек
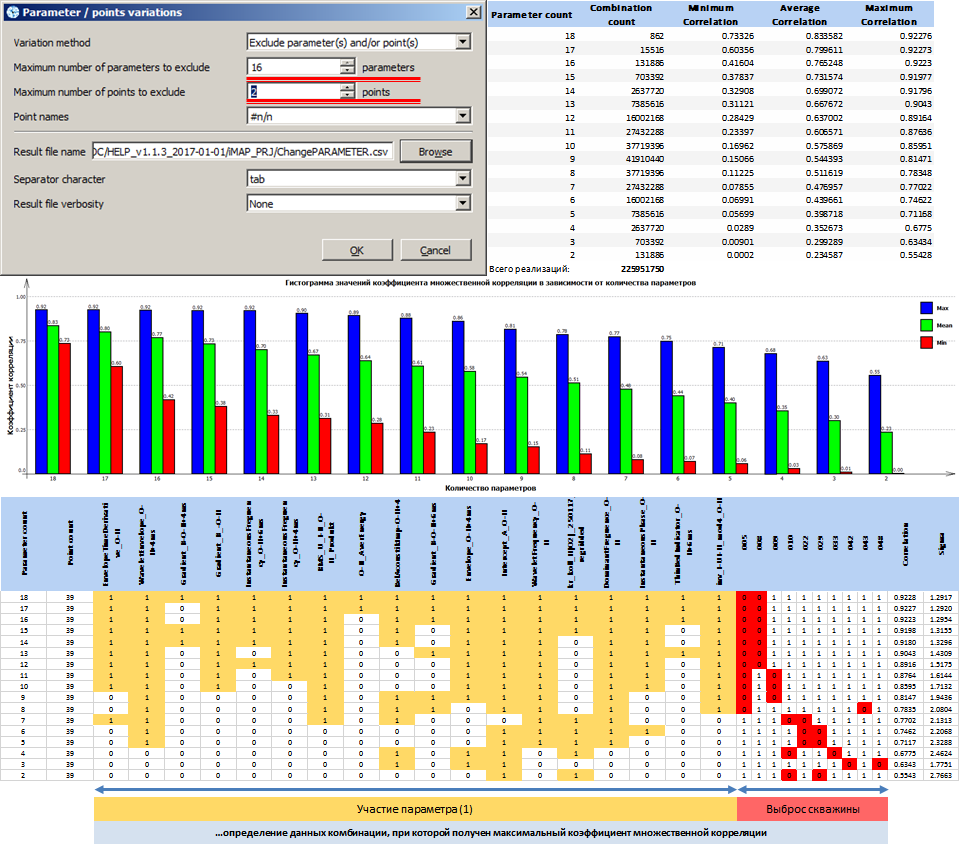
Расчет всех комбинаций с исключением до 16 (включительно) параметров и до 2 (включительно) точек
В настоящее время нет единой методики для определения лучшего количества параметров-регрессоров при применении многомерной линейной регрессии. Большее количество параметров приводит к увеличению коэффициента корреляции, но физический смысл полученного решения при применении большого количества регрессоров объяснить становится невозможно.
Given number of parameter combinations
Данный метод предназначен для детального анализа влияния того или иного параметра-регрессора на величину коэффициента множественной корреляции MC при постоянном заданном количестве атрибутов и всех точек-эталонов. На следующем примере показаны результаты применения данного метода вариаций для всех комбинаций из 7 параметров регрессоров (всего в расчете 18 регрессоров).
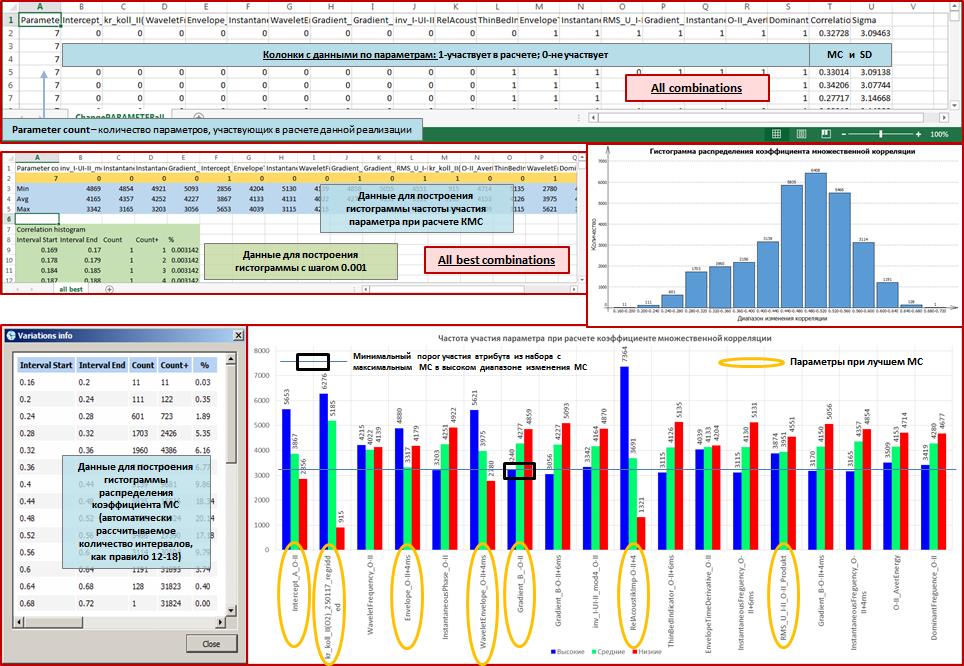
Гистограмма распределения MC и анализ частоты участия регрессоров в распределении MC
Given number of point combinations
Данный метод предназначен для детального анализа влияния той или иной точки-эталона на величину коэффициента множественной корреляции MC при постоянном количестве точек-эталонов и всех атрибутов. На следующем примере показаны результаты применения данного метода вариаций для всех комбинаций из 35 скважин (всего в расчете 41 скважина) и 7 атрибутов-регрессоров, количество которых неизменно и постоянно.

Гистограмма распределения MC и анализ частоты участия точек-эталонов в распределении MC
Plotting and export
The IngeosMAP software has the ability to directly print on a printer/plotter and export to *.PDF format the generated graphic applications and pictures.
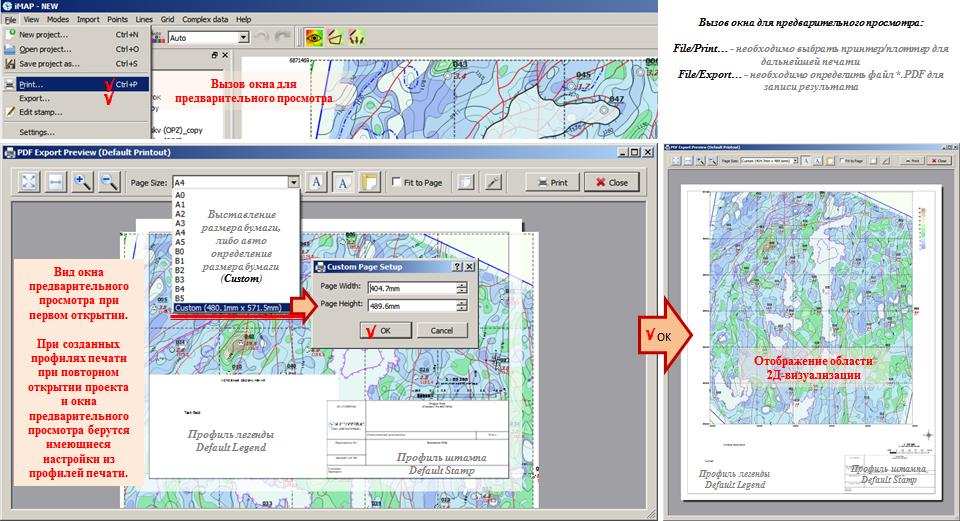
Вызов окна для предварительного просмотра и установка параметров размера страницы
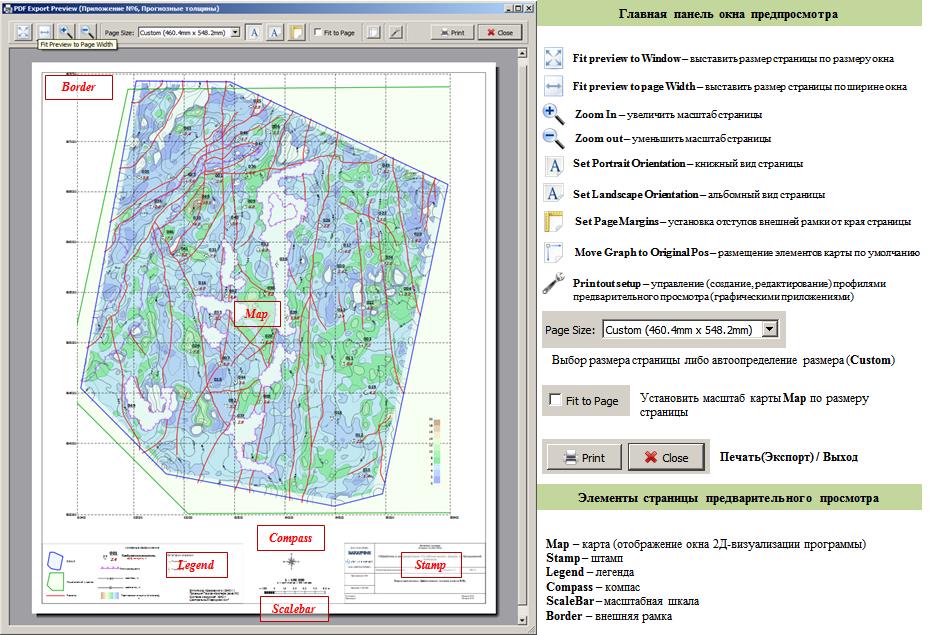
Панель инструментов и элементы профиля предварительного просмотра (графического приложения)
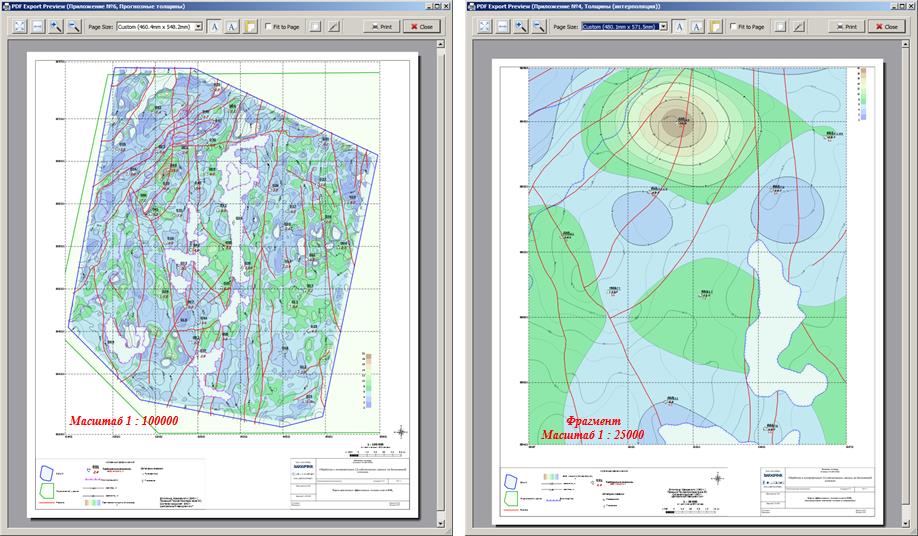

Примеры создания графических приложений в рамках одного проекта
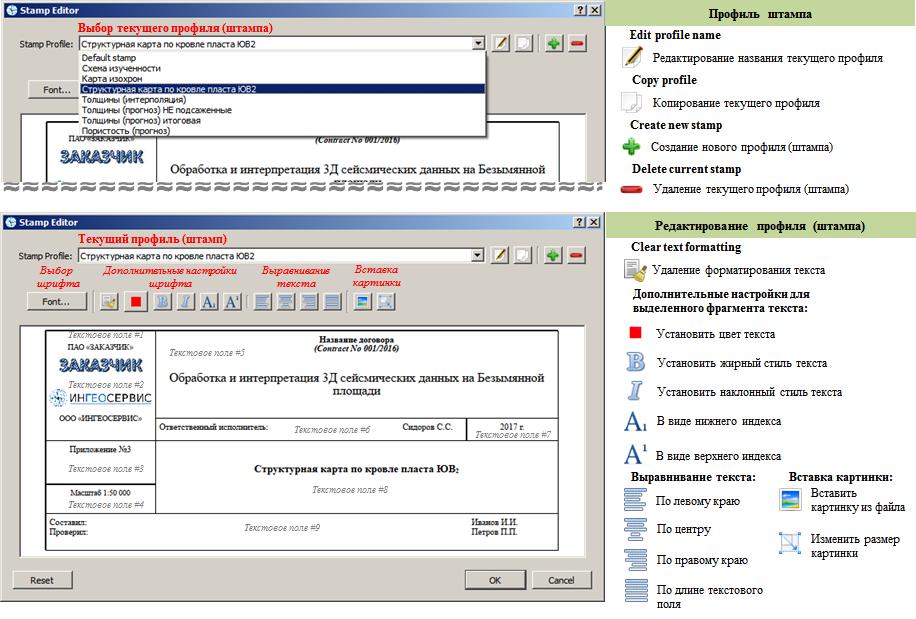
Окно редактора штампов графических приложений
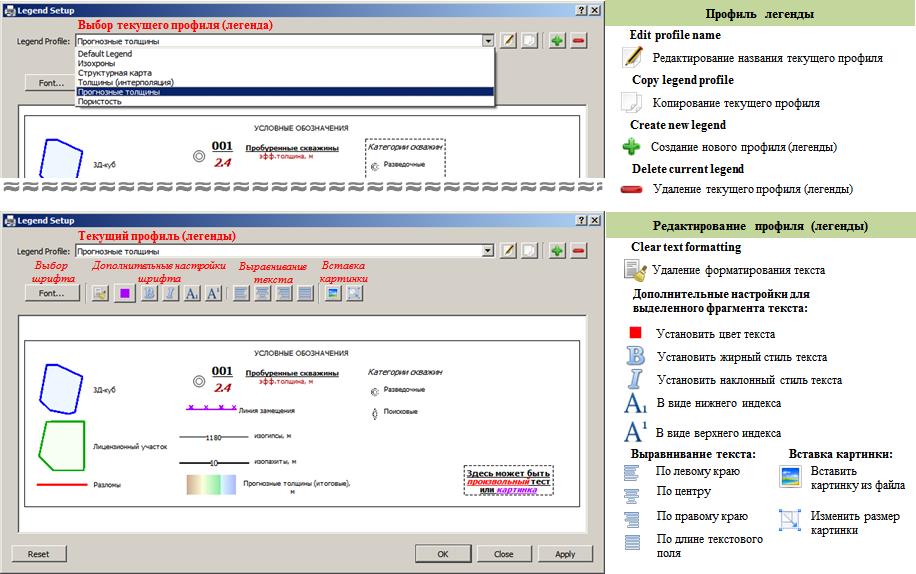
Создание и редактирование профилей легенд