Updates of the IngeosMAP (iMAP)® software – designed for 2D-geological digital modelling, have been released.
1.Switching to the PROJ9 library for operating with coordinates.
The following systems and projections have been added to the list for working with coordinates:
- Geographic Geodetic Reference System (GSK)2011;
- Rectangular projection GSK2011 for each zone (with and without zone number);
- EPSG:987654 – simple conical projection with one standard parallel for the territory of the Russian Federation;
- simple conical projection with one standard parallel for the territory of KhMAO;
- simple conical projection with one standard parallel for the YNAO Territory.

2.Added the ability to copy and paste parameters of object’s label (color and font) in the Object Tree.

3.Storing Custom Palettes in a Project File
Users palettes are stored in the project file itself. Users palettes are located at the top of the palette list, beginning with a “#” character. When you open a project on another computer, users palettes will be available. Palettes created by a user in previous versions (starting with “_user_”) will not be available in the palette list. They can be loaded from files stored in the users palettes folder.
To the left of the list of palettes, a button has been added to call the palette editor.

4.User’s logo placement and scaling.
Implemented the ability to position the logo strictly in a certain position relative to the corners of the object visualization area. The user must define a corner and set offsets from the selected corner. Interactive (with the mouse) positioning of the logo is possible in the Project coord mode. Logo scaling has also been implemented. The settings window is called by double-clicking on the logo, or via the Settings button on the toolbar and then selecting the Logo tab. The current user settings are stored in the project, i.e. when opened on another computer, the settings will be saved.

5.User’s positioning and automatic labeling of the color bar.

Implemented the ability to position the color scale of the grid strictly in a certain position relative to the corners of the object visualization area. The user must define a corner and set offsets from the selected corner. Interactive (using the mouse) arrangement of the color palette is possible in the Project coord mode. The window with the settings is called by double-clicking on the color bar, or through the Settings button on the toolbar and then selecting the Color Bar tab. The current user settings are stored in the project, i.e. when opened on another computer, the settings will be saved.
A new grid property has been added – the label of the color scale. When rendering a certain grid, the scale will be labeled individually. To visualize the color scale label, use the Show signature checkbox, located in the Color Bar tab of the Settings window. The text of label is set in the Text Edit window, which is called by the Color Scale Signature-Edit button. To apply the entered parameters, click the Apply button located in the upper part of the Properties window. Possibility of setting the graphical properties of the label similarly to a text object.
6.User’s scale bar location and scale calibration, depending on the operator’s monitor.

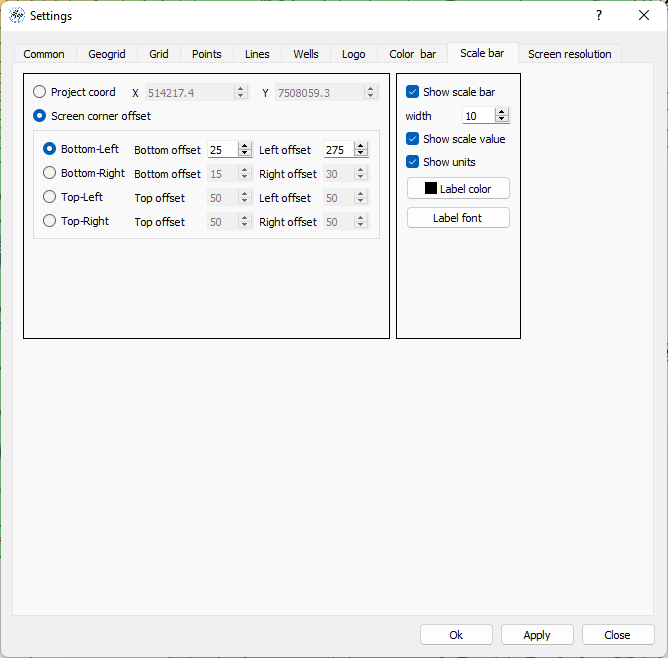
Implemented the ability to position the scale bar of the visualization area strictly in a certain position relative to the corners of the object visualization area. The user must define a corner and set offsets from the selected corner. Interactive (using the mouse) location of the scale bar is possible in the Project coordmode. The window with the settings is called by double-clicking on the scale bar, or through the Settings button панели on the toolbar and then selecting the Scale Bar tab. The current user settings are stored in the project, i.e. when opened on another computer, the settings will be saved.
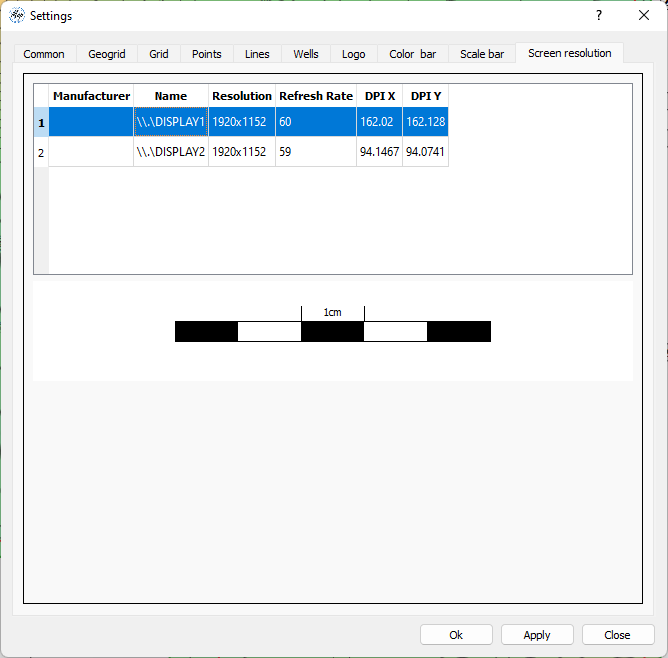
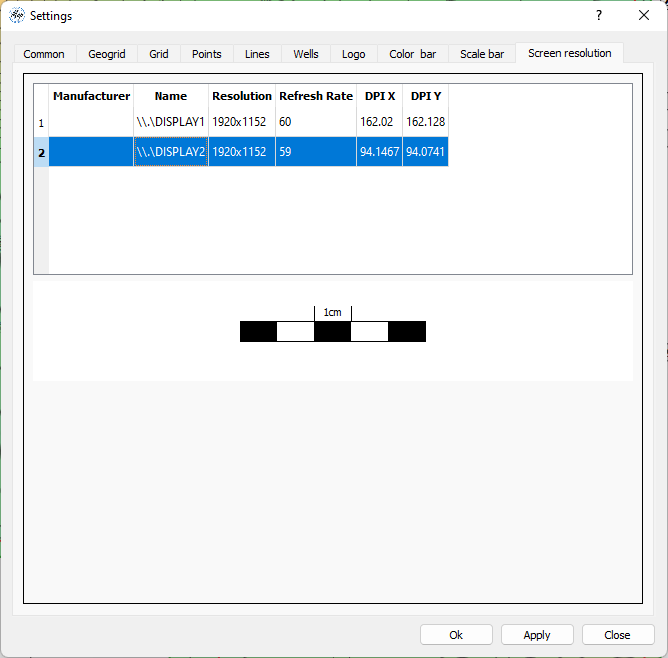
Implemented calibration of the scale and scale bar relative to the active monitor. Essential when working with monitors with different parameters, for example, a laptop (14”) and an additional monitor (24”) with the same resolution and different DPI. The monitor is selected in the Screen resolution tab of the Settings window.


7.Converting wellheads and bottomholes to point objects.

In the Edit wells table, with basic information on wells, columns with coordinates and TVDSS of bottomholes have been added. Also implemented is the ability to convert data into a point object with its automatic placement in the object tree. To convert, click the Convert to Points object button in the lower left corner of the Edit wellswindow. To create a point object with the coordinates of the bottoms of the well, the user must enable the Bottom positioncheckbox.
Resolved Issues:
- program crash when calling the point object calculator, if there are no point objects in the project;
- auto-rotate the color palette when multiplying the grid by “-1” through quick math operations;
- program crash when working with crossplots (adjusted the mode of point parameter labels when adding them to the crossplot and then deleting the parameter through the point object editor window or the calculator);
- fixed a bug that occurred when drawing tops of temporary contours outside the map building area;
- fixed a bug when editing using vectors, when the start or end points are outside the map building area;
- fixed the error of moving (disappearing) objects (no changes were made when opening them) inside subfolders in the object tree.


